I am trying to set up and debug Behat scenarios through PhpStorm but I cannot get it working so far. By scenarios I mean I would expect the debugger stops in the real code, not in a Context file which actually it does. I am using Docker and PHP 8.0.x with Xdebug 3.0.4. Here is what I have done:
Setup the PHP Interpreter (nothing weird here, just follow the usual steps to register a new interpreter)
Setup Behat testing tool
Right-click on the scenario I want to test which creates a Run configuration:
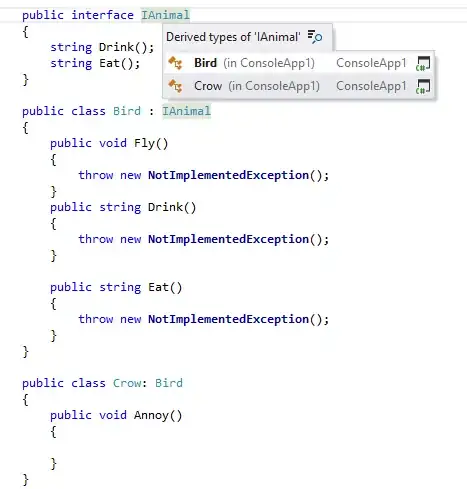
Adding a breakpoint in any Context file used in the scenario makes the debugger to stops when I hit the small green bug icon (the one next to the green play button)


But from there, the debugger never reaches the real code, which I would like to debug (and yes I have several breakpoints in the real code).
Useful information:
Xdebug is enabled and is configured as follow (taken from php -i):
Version => 3.0.4
Support Xdebug on Patreon, GitHub, or as a business: https://xdebug.org/support

Feature => Enabled/Disabled
Development Aids => ✔ enabled
Coverage => ✘ disabled
GC Stats => ✘ disabled
Profiler => ✘ disabled
Step Debugger => ✔ enabled
Tracing => ✘ disabled

Debugger => enabled
IDE Key => PHPSTORM

Directive => Local Value => Master Value
xdebug.auto_trace => (setting renamed in Xdebug 3) => (setting renamed in Xdebug 3)
xdebug.cli_color => 0 => 0
xdebug.client_discovery_header => no value => no value
xdebug.client_host => host.docker.internal => host.docker.internal
xdebug.client_port => 9003 => 9003
xdebug.cloud_id => no value => no value
xdebug.collect_assignments => Off => Off
xdebug.collect_includes => (setting removed in Xdebug 3) => (setting removed in Xdebug 3)
xdebug.collect_params => (setting removed in Xdebug 3) => (setting removed in Xdebug 3)
xdebug.collect_return => Off => Off
xdebug.collect_vars => (setting removed in Xdebug 3) => (setting removed in Xdebug 3)
xdebug.connect_timeout_ms => 200 => 200
xdebug.coverage_enable => (setting renamed in Xdebug 3) => (setting renamed in Xdebug 3)
xdebug.default_enable => (setting renamed in Xdebug 3) => (setting renamed in Xdebug 3)
xdebug.discover_client_host => Off => Off
xdebug.dump.COOKIE => no value => no value
xdebug.dump.ENV => no value => no value
xdebug.dump.FILES => no value => no value
xdebug.dump.GET => no value => no value
xdebug.dump.POST => no value => no value
xdebug.dump.REQUEST => no value => no value
xdebug.dump.SERVER => no value => no value
xdebug.dump.SESSION => no value => no value
xdebug.dump_globals => On => On
xdebug.dump_once => On => On
xdebug.dump_undefined => Off => Off
xdebug.file_link_format => no value => no value
xdebug.filename_format => no value => no value
xdebug.force_display_errors => Off => Off
xdebug.force_error_reporting => 0 => 0
xdebug.gc_stats_enable => (setting renamed in Xdebug 3) => (setting renamed in Xdebug 3)
xdebug.gc_stats_output_dir => (setting renamed in Xdebug 3) => (setting renamed in Xdebug 3)
xdebug.gc_stats_output_name => gcstats.%p => gcstats.%p
xdebug.halt_level => 0 => 0
xdebug.idekey => no value => no value
xdebug.log => /tmp/xdebug.log => /tmp/xdebug.log
xdebug.log_level => 7 => 7
xdebug.max_nesting_level => 256 => 256
xdebug.max_stack_frames => -1 => -1
xdebug.mode => develop,debug => develop,debug
xdebug.output_dir => /tmp => /tmp
xdebug.overload_var_dump => (setting removed in Xdebug 3) => (setting removed in Xdebug 3)
xdebug.profiler_append => Off => Off
xdebug.profiler_enable => (setting renamed in Xdebug 3) => (setting renamed in Xdebug 3)
xdebug.profiler_enable_trigger => (setting renamed in Xdebug 3) => (setting renamed in Xdebug 3)
xdebug.profiler_enable_trigger_value => (setting renamed in Xdebug 3) => (setting renamed in Xdebug 3)
xdebug.profiler_output_dir => (setting renamed in Xdebug 3) => (setting renamed in Xdebug 3)
xdebug.profiler_output_name => cachegrind.out.%p => cachegrind.out.%p
xdebug.remote_autostart => (setting renamed in Xdebug 3) => (setting renamed in Xdebug 3)
xdebug.remote_connect_back => (setting renamed in Xdebug 3) => (setting renamed in Xdebug 3)
xdebug.remote_enable => (setting renamed in Xdebug 3) => (setting renamed in Xdebug 3)
xdebug.remote_host => (setting renamed in Xdebug 3) => (setting renamed in Xdebug 3)
xdebug.remote_log => (setting renamed in Xdebug 3) => (setting renamed in Xdebug 3)
xdebug.remote_log_level => (setting renamed in Xdebug 3) => (setting renamed in Xdebug 3)
xdebug.remote_mode => (setting renamed in Xdebug 3) => (setting renamed in Xdebug 3)
xdebug.remote_port => (setting renamed in Xdebug 3) => (setting renamed in Xdebug 3)
xdebug.remote_timeout => (setting renamed in Xdebug 3) => (setting renamed in Xdebug 3)
xdebug.scream => Off => Off
xdebug.show_error_trace => Off => Off
xdebug.show_exception_trace => Off => Off
xdebug.show_local_vars => Off => Off
xdebug.show_mem_delta => (setting removed in Xdebug 3) => (setting removed in Xdebug 3)
xdebug.start_upon_error => default => default
xdebug.start_with_request => yes => yes
xdebug.trace_enable_trigger => (setting renamed in Xdebug 3) => (setting renamed in Xdebug 3)
xdebug.trace_enable_trigger_value => (setting renamed in Xdebug 3) => (setting renamed in Xdebug 3)
xdebug.trace_format => 0 => 0
xdebug.trace_options => 0 => 0
xdebug.trace_output_dir => (setting renamed in Xdebug 3) => (setting renamed in Xdebug 3)
xdebug.trace_output_name => trace.%c => trace.%c
xdebug.trigger_value => no value => no value
xdebug.var_display_max_children => 128 => 128
xdebug.var_display_max_data => 512 => 512
xdebug.var_display_max_depth => 3 => 3
The request (in this case is a POST) is being sent using Guzzle as following and as you can see I have set a Cookie for the XDEBUG_SESSION
use GuzzleHttp\Client as GuzzleHttpClient;
use GuzzleHttp\Psr7\Request;

$this->httpClient = new GuzzleHttpClient(['cookies' => true]);

$request = new Request($method, $url, $this->storage()->get('headers'));
$options = [
    'verify' => false,
    'on_stats' => [$this, 'guzzleRequestStats'],
    'headers' => ["Cookie" => "XDEBUG_SESSION=PHPSTORM"]
];

$this->httpClient->sendAsync($request, $options);
When debugging the Behat scenario through PhpStorm this is what is written to the console:
php -dxdebug.mode=debug -dxdebug.client_port=9003 -dxdebug.client_host=172.17.0.1 -d xdebug.start_with_request=yes /opt/.phpstorm_helpers/behat.php --format PhpStormBehatFormatter --no-interaction --suite=default --format=progress --config /var/www/framework/behat.yml /var/www/framework/features/check_status.feature:6
And Xdebug writes the following to logs:
[183] Log opened at 2021-07-25 18:34:18.374219
[183] [Step Debug] INFO: Connecting to configured address/port: host.docker.internal:9003.
[183] [Step Debug] INFO: Connected to debugging client: host.docker.internal:9003 (through xdebug.client_host/xdebug.client_port). :-)
[183] [Step Debug] -> <init xmlns="urn:debugger_protocol_v1" xmlns:xdebug="https://xdebug.org/dbgp/xdebug" fileuri="file:///tmp/dbgHITriA" language="PHP" xdebug:language_version="8.0.8" protocol_version="1.0" appid="183"><engine version="3.0.4"><![CDATA[Xdebug]]></engine><author><![CDATA[Derick Rethans]]></author><url><![CDATA[https://xdebug.org]]></url><copyright><![CDATA[Copyright (c) 2002-2021 by Derick Rethans]]></copyright></init>

[183] [Step Debug] <- feature_set -i 1 -n show_hidden -v 1
[183] [Step Debug] -> <response xmlns="urn:debugger_protocol_v1" xmlns:xdebug="https://xdebug.org/dbgp/xdebug" command="feature_set" transaction_id="1" feature="show_hidden" success="1"></response>

[183] [Step Debug] <- feature_set -i 2 -n max_depth -v 1
[183] [Step Debug] -> <response xmlns="urn:debugger_protocol_v1" xmlns:xdebug="https://xdebug.org/dbgp/xdebug" command="feature_set" transaction_id="2" feature="max_depth" success="1"></response>

[183] [Step Debug] <- feature_set -i 3 -n max_children -v 100
[183] [Step Debug] -> <response xmlns="urn:debugger_protocol_v1" xmlns:xdebug="https://xdebug.org/dbgp/xdebug" command="feature_set" transaction_id="3" feature="max_children" success="1"></response>

[183] [Step Debug] <- feature_set -i 4 -n extended_properties -v 1
[183] [Step Debug] -> <response xmlns="urn:debugger_protocol_v1" xmlns:xdebug="https://xdebug.org/dbgp/xdebug" command="feature_set" transaction_id="4" feature="extended_properties" success="1"></response>

[183] [Step Debug] <- feature_set -i 5 -n notify_ok -v 1
[183] [Step Debug] -> <response xmlns="urn:debugger_protocol_v1" xmlns:xdebug="https://xdebug.org/dbgp/xdebug" command="feature_set" transaction_id="5" feature="notify_ok" success="1"></response>

[183] [Step Debug] <- feature_set -i 6 -n resolved_breakpoints -v 1
[183] [Step Debug] -> <response xmlns="urn:debugger_protocol_v1" xmlns:xdebug="https://xdebug.org/dbgp/xdebug" command="feature_set" transaction_id="6" feature="resolved_breakpoints" success="1"></response>

[183] [Step Debug] <- stdout -i 7 -c 1
[183] [Step Debug] -> <response xmlns="urn:debugger_protocol_v1" xmlns:xdebug="https://xdebug.org/dbgp/xdebug" command="stdout" transaction_id="7" success="1"></response>

[183] [Step Debug] <- status -i 8
[183] [Step Debug] -> <response xmlns="urn:debugger_protocol_v1" xmlns:xdebug="https://xdebug.org/dbgp/xdebug" command="status" transaction_id="8" status="starting" reason="ok"></response>

[183] [Step Debug] <- step_into -i 9
[183] [Step Debug] -> <response xmlns="urn:debugger_protocol_v1" xmlns:xdebug="https://xdebug.org/dbgp/xdebug" command="step_into" transaction_id="9" status="break" reason="ok"><xdebug:message filename="file:///tmp/dbgHITriA" lineno="5"></xdebug:message></response>

[183] [Step Debug] <- eval -i 10 -- aXNzZXQoJF9TRVJWRVJbJ1BIUF9JREVfQ09ORklHJ10p
[183] [Step Debug] -> <response xmlns="urn:debugger_protocol_v1" xmlns:xdebug="https://xdebug.org/dbgp/xdebug" command="eval" transaction_id="10"><property type="bool"><![CDATA[1]]></property></response>

[183] [Step Debug] <- eval -i 11 -- KHN0cmluZykoJF9TRVJWRVJbJ1BIUF9JREVfQ09ORklHJ10p
[183] [Step Debug] -> <response xmlns="urn:debugger_protocol_v1" xmlns:xdebug="https://xdebug.org/dbgp/xdebug" command="eval" transaction_id="11"><property type="string" size="25" encoding="base64"><![CDATA[c2VydmVyTmFtZT1hcGkuZWxpbnZvLmNvbQ==]]></property></response>

[183] [Step Debug] <- detach -i 12
[183] [Step Debug] -> <response xmlns="urn:debugger_protocol_v1" xmlns:xdebug="https://xdebug.org/dbgp/xdebug" command="detach" transaction_id="12" status="stopping" reason="ok"></response>
What I am missing here?