I'm trying do define an interface in which I want to plot some values received by an external device. These values are received with a frequency that can be set through the interface. Of course the period of the plot should change according to the period defined by the user. So I started to define the followint Chart:
int periodMs = 200;
MilliDTSC dataset = new MilliDTSC(1,100, new MultipleOfMillisecond(periodMs));
dataset.setTimeBase(new MultipleOfMillisecond(periodMs))
dataset.addSeries(zeroSeries()),0,"Zero data") // zeroSeries returs a series with values set to 0
JFreeChart chart = createChart(dataset) // create the chart and set ranges and legends
ChartPanel panel = new ChartPanel(panel);
MilliDTSC is the following class, as suggested here:
public class MilliDTSC extends DynamicTimeSeriesCollection{
  public MilliDTSC(int nSeries, int nMoments, RegularTimePeriod timeSample){
    super(nSeries, nMoments, timeSample);
    if(timeSample instanceof Millisecond)
      this.pointsInTime = new Millisecond[nMoments]
    else if (timeSample instanceof MultipleOfMillisecond)
      this.pointsInTime = new MultipleOfMillisecond[nMoments]
  }
}
MultipleOfMillisecond is the following class:
public class MultipleOfMilliseconds extends Millisecond{
  MulitpleOfMilliseconds(int periodMs){
    this.periodMs = periodMs
  }

  public RegularTimePeriod previous(){
    RegularTimePeriod result = null;
    if(getMillisecond() - periodMs >= FIRST_MILLISECOND_IN_SECOND)
      result = new Millisecond((int)getMillisecond - periodMs, getSecond());
    else{
      Second previous = (Second)getSecond().previous();
      if(previous!=null)
        result = new Millisecond((int)(getMillisecond() - periodMS + LAST_MILLISECOND_IN_SECOND + 1), previous);
    }
    return result;
  }
  // similar for next()
}
I add sample to the series in the following way:
dataset.advanceTime();
dataset.appendData(newData);
What I expected is that once I fixed the period to 200 ms the chart reports on the X label more or less 5 time values:
00:00:00.000 00:00:05.000 00:00:10.000 00:00:15.000 00:00:20.000
And I expected 25 samples in each "space".
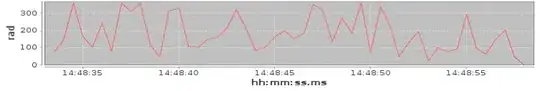
What happen instead is that I have 25 samples for each "space" but the chart reports the following values on the X label:
00:00:00.000 00:00:00.025 00:00:00.050 00:00:00.075 00:00:00.100
It seems that the period is 1ms but I'm adding samples very 200 ms.
How can I solve the problem? If I was not clear pleas tell me. Thanks!!