50

I know how I can debug a remote Java VM with Eclipse, but how can I do it with a Java Web Start program. I have a problem that only occurs in Java Web Start. It must be security related.

I need a solution that will work with a current Java VM like 1.6.0_12.

bakoyaro
  • 2,550
  • 3
  • 36
  • 63
Horcrux7
  • 23,758
  • 21
  • 98
  • 156

10 Answers10

25

It's quite the same like with any other Java process you want to debug remotely: You have to set up some arguments for the VM (-Xdebug -Xnoagent -Xrunjdwp:transport=dt_socket,server=n,suspend=y,address=12345 ) and then connect to the given port. In Java webstart 6.0 this can be done with the -J option, in earlier version via environment variable JAVAWS_VM_ARGS. See details here.

bakoyaro
  • 2,550
  • 3
  • 36
  • 63
Kai Huppmann
  • 10,705
  • 6
  • 47
  • 78
  • 1
    Just a note: using Ubuntu 10.04 and 12.04 and webstart 6.0, it only worked after I set **server=y** parameter. Otherwise, I got the error `ERROR: JDWP Transport dt_socket failed to initialize, TRANSPORT_INIT(510)`, even if the port was not in use. – Joaquim Oliveira May 13 '14 at 20:11
  • This answer doesn't work for me (for the same reason as another) because the command `javaws` will open the debugger on the specified port then launch another JVM, which will try to do the same. The end result is "address already in use" and the JVM exits. – Jason Aug 31 '18 at 01:47
23

Start the JWS VM manually. This way you can provide the startup parameters to open the debug port. Here is a description, it goes like this:

set JAVAWS_TRACE_NATIVE=1
set JAVAWS_VM_ARGS="-Xdebug -Xnoagent -Djava.compiler=NONE -Xrunjdwp:transport=dt_socket,address=8989,server=y,suspend=n"
javaws http://server:port/descriptor.jnlp
mkoeller
  • 4,469
  • 23
  • 30
  • 1
    +1 for awesome answer. However, this thing won't let me edit it to fix a typo in the answer. There should be no space before the "address=8989". – fool4jesus Apr 20 '11 at 03:36
  • @mkoeller in javaws http://server:port/descriptor.jnlp which port number should i give – Rekha Jan 30 '12 at 04:24
  • 6
    Just a note, in Windows (Tested on XP) when you set `JAVAWS_VM_ARGS` you have to OMIT THE DOUBLE QUOTES `set JAVAWS_VM_ARGS=-Xdebug -Xnoagent -Djava.compiler=NONE -Xrunjdwp:transport=dt_socket,address=8989,server=y,suspend=n` – Jaime Hablutzel Sep 12 '12 at 17:31
  • instead of using 'set' using 'export' works for me on Mac OS X High Sierra. Export sets the variables in the shell and is available in child processes from it. – Vincent Gerris Jul 31 '18 at 10:47
  • This answer is not working for me on macOS High Sierra. The problem seems to be the "javaws" command starts in debug mode (opening port 8989) and later starts my application with a new VM which tries to also open that port. The second VM gives me the error "address already in use" and then quits. – Jason Aug 31 '18 at 01:29
  • Thanks a lot, this helped me :). Works perfectly with java 8 (tested with batch file). – aimhaj Feb 26 '19 at 10:19
16

As for newer versions of Java (Java 8u20+ and Java 7u70+) i experienced that parameters like -Xrunjdwp cannot be passed directly nor using JAVAWS_VM_ARGS. Message Rejecting attempt to specify insecure property: -Xrunjdwp:transport=dt_socket,server=y,suspend=y,address=8000 started to show up in console output.

The only solution that worked for me was to pass those arguments into JAVA_TOOL_OPTIONS system variable.

Vojtěch Tůma
  • 161
  • 1
  • 4
  • 1
    Thanks for writing this, you solved it for me. Needed to delete the debug options from JAVAWS_VM_ARGS and move them to JAVA_TOOL_OPTIONS when moving from 1.7.0_10 to 1.7.0_75 – Gonen I Apr 02 '15 at 07:28
  • This worked for me as well, I have several jdks on my machine so I never quite know which will be started :-| – bakoyaro May 22 '15 at 14:51
  • 3
    I tried this but some kind of security check must have prevented my javaws from starting (with JAVA_TOOL_OPTIONS it would not start, without this it would start). – Graeme Moss Sep 17 '15 at 12:26
9

You can also provide the debug parameter to the javaws executable using the -J option

Example:

javaws.exe -J-Xdebug -J-Xnoagent -J-Xrunjdwp:transport=dt_socket,server=y,suspend=n,address=8000 http://server:port/descriptor.jnlp
Marco Montel
  • 581
  • 7
  • 13
4

You will need to do the following:

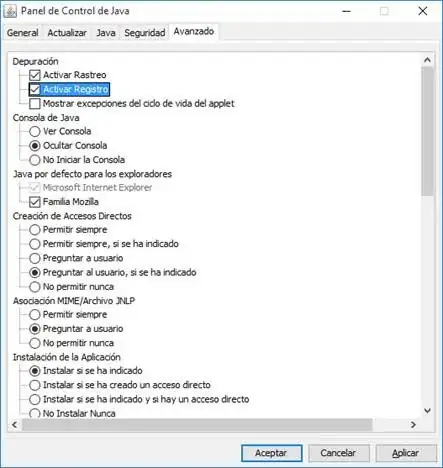
  1. Enable the Java logs and tracing in the Java Control Panel > Advanced. Java Control Panel: logs and tracing

  2. Enable parameters for debugging Java (optional but useful i.e. problems with tls/ssl handshake as close_notify or handshake_failure) & launching the JNLP, there are two ways you can do it:

    2.a. Download the JNLP file and execute it from command line (the SET command is not required in this particular case).

    set JAVA_TOOL_OPTIONS=-Djavax.net.debug=all
    javaws -wait jnlp.jnlp
    

    2.b. Add arguments (i.e. -Djavax.net.debug=all) for the JVM in the Java Control Panel > Java > View (this is not required in this particular), and launch the JNLP file from browser:

    Java Control Panel: jvm arguments

  3. The logs and traces are located in the log directory from the Java Deployment Home from where I paste these locations:

    a. Windows XP: %HOME%\Application Data\Sun\Java\Deployment

    b. Windows 7/Vista: %APPDATA%\..\LocalLow\Sun\Java\Deployment

    c. Linux/Solaris: %HOME%/.java/deployment

With javax.net.debug=all you will see the handshake if the jar inside the jnlp is loaded from an https connection. This kind of problems are hard to debug.

...
%% No cached client session
*** ClientHello, TLSv1.2
...
***
... 
Java Web Start Main Thread, received EOFException: error
Java Web Start Main Thread, handling exception: javax.net.ssl.SSLHandshakeException: Remote host closed connection during handshake
Java Web Start Main Thread, SEND TLSv1.2 ALERT:  fatal, description = handshake_failure
Java Web Start Main Thread, WRITE: TLSv1.2 Alert, length = 2
Java Web Start Main Thread, called closeSocket()
#### Java Web Start Error:
lmiguelmh
  • 3,074
  • 1
  • 37
  • 53
3

With Java 8 and Windows 10, open command prompt (cmd.exe) and type this:

set JAVAWS_TRACE_NATIVE=1
set JAVA_TOOL_OPTIONS=-Xdebug -Xnoagent -Xrunjdwp:transport=dt_socket,server=y,suspend=n,address=8000
javaws java-app.jnlp

After that, in Eclipse (or another IDE) start the normal remote java application debugging set to the port used in the command above (in this case 8000)

qwertzguy
  • 15,699
  • 9
  • 63
  • 66
  • 1
    About debugging a .jnlp in Eclipse. In Eclipse, you can create a remote Java application with a declared debug port. If you start the remote debug app (pointing to the same debug port) *before( you start the .jnlp app then the .jnlp app won't connect to the open debug port. Solution is to terminate and relaunch the debug process. – J Slick Nov 29 '22 at 23:04
  • @JSlick thank you for the note! I updated my answer to add the instructions for Eclipse. – qwertzguy Feb 03 '23 at 22:39
3

You can run your JNLP with debugging enabled:

javaws -Xnosplash -J-agentlib:jdwp=transport=dt_socket,server=y,suspend=n,address=5009 <application>.jnlp

Output: Listening for transport dt_socket at address: 5009

Attach to this with your favorite IDE, I use IntelliJ IDEA Run>Attach to process

Jorduino
  • 61
  • 1
  • 7
  • Would you mind explaining more details about "attach to process"? In IDE or command line. – Corey Sep 16 '19 at 09:50
2

To debug a Web Start application in Linux, create a shell script ~/bin/javaws-debug.sh with the javaws invocation in debug mode as described above:

~/bin/javaws-debug.sh:

#!/bin/sh
export JAVAWS_TRACE_NATIVE=1
export JAVAWS_VM_ARGS="-Xdebug -Xnoagent -Djava.compiler=NONE 
  -Xrunjdwp:transport=dt_socket,address=8989,server=y,suspend=n"
javaws "$@"

Then, in your browser, choose that script as the application to invoke on jnlp files.

For example, in Firefox, go to Edit→Preferences→Applications, Content Type: Java Web Start, and choose "Use Other" in Action and pick the script from the "Select Helper Application" dialog. In Chrome, you need to alter Linux system settings. In KDE, go to System Settings→File Associations, Known Types: application:x-java-jnlp-file, add a new Application, pick ~/bin/javaws-debug.sh from the "Choose Application for application/x-java-jnlp-file" dialog.

Once your browser is configured, Java Web Start application will start using your wrapper, which will enable debugger to connect on port 8989.
Nicholas Sushkin
  • 13,050
  • 3
  • 30
  • 20
1

Have you tried printing a debug log? That is a useful thing to have at any rate, and might help in this case.

If you want real debugging, see e.g. here: How can I debug under WebStart?

sleske
  • 81,358
  • 34
  • 189
  • 227
  • That's really cool to have direct control over all aspects of running the JVM... And you can also look up all the stuff that WS launcher adds from its initial screen upon running it... – Sergey Ushakov Nov 17 '14 at 11:31
1

This is what worked for me with IcedTea-Web :

set JAVAWS_TRACE_NATIVE=1
set JAVA_TOOL_OPTIONS=-Xdebug -Xnoagent -Djava.compiler=NONE -Xrunjdwp:transport=dt_socket,address=8989,server=y,suspend=y
javaws -Xnofork my_jnlp_file.jnlp

Option -Xnofork was required or else the settings didn't apply to the forked jvm of the application.

Sybuser
  • 735
  • 10
  • 27