8

I have a vector of data, which contains integers in the range -20 20.

Bellow is a plot with the values:

enter image description here

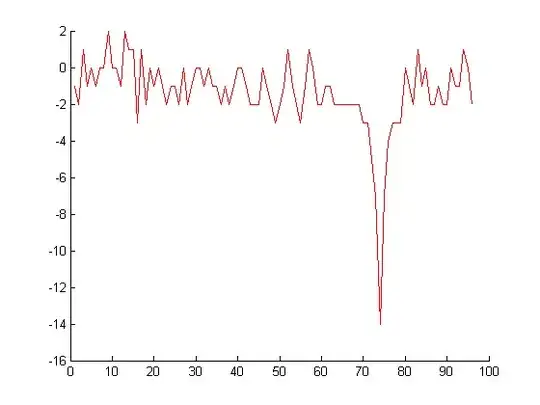
This is a sample of 96 elements from the vector data. The majority of the elements are situated in the interval -2, 2, as can be seen from the above plot.

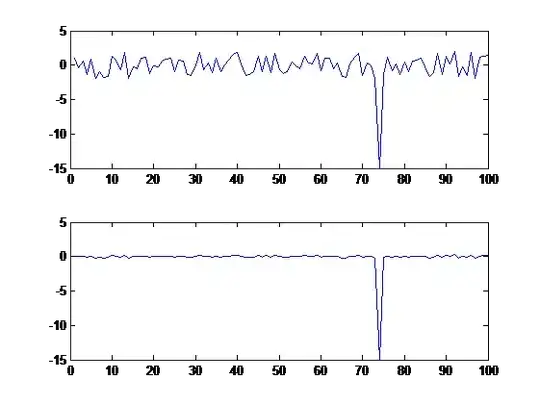
I want to eliminate the noise from the data. I want to eliminate the low amplitude peaks, and keep the high amplitude peak, namely, peaks like the one at index 74.

Basically, I just want to increase the contrast between the high amplitude peaks and low amplitude peaks, and if it would be possible to eliminate the low amplitude peaks.

Could you please suggest me a way of doing this?

I have tried mapstd function, but the problem is that it also normalizes that high amplitude peak.

I was thinking at using the wavelet transform toolbox, but I don't know exact how to reconstruct the data from the wavelet decomposition coefficients.

Can you recommend me a way of doing this?

Amro
  • 123,847
  • 25
  • 243
  • 454
Simon
  • 4,999
  • 21
  • 69
  • 97
  • 1
    "Normalize" usually means "linearly scale so that the maximum is in [-1 1]". This won't change the relative values of the peak and the low-amplitude data. When you say you want to eliminate the low amplitude peaks, do you mean you want to increase the contrast between the signal and noise? – hughes Jul 29 '11 at 13:18
  • Yes, exactly. I just want to eliminate the noise from the signal. – Simon Jul 29 '11 at 13:23
  • You need to apply a non-linear function, commonly known as a "dead band" - effectively you just set all values whose magnitude is less than a given threshold to zero. – Paul R Jul 29 '11 at 13:25
  • Is there some sort of example for this or a matlab toolbox/function? – Simon Jul 29 '11 at 13:26
  • @hughes: I think I have done the proper editing to the question so that it would more clear. – Simon Jul 29 '11 at 13:27
  • So, what you want is to apply a standard high-pass filter, if I understand you correctly? – Bjarke Freund-Hansen Aug 03 '11 at 10:49

5 Answers5

9

One approach to detect outliers is to use the three standard deviation rule. An example:

%# some random data resembling yours
x = randn(100,1);
x(75) = -14;
subplot(211), plot(x)

%# tone down the noisy points
mu = mean(x); sd = std(x); Z = 3;
idx = ( abs(x-mu) > Z*sd );         %# outliers
x(idx) = Z*sd .* sign(x(idx));      %# cap values at 3*STD(X)
subplot(212), plot(x)

enter image description here


EDIT:

It seems I misunderstood the goal here. If you want to do the opposite, maybe something like this instead:

%# some random data resembling yours
x = randn(100,1);
x(75) = -14; x(25) = 20;
subplot(211), plot(x)

%# zero out everything but the high peaks
mu = mean(x); sd = std(x); Z = 3;
x( abs(x-mu) < Z*sd ) = 0;
subplot(212), plot(x)

enter image description here

Amro
  • 123,847
  • 25
  • 243
  • 454
  • Is this a good approach if I'm trying to remove low amplitude signal on an audio file? Like someone talking far away. – Mauker Apr 28 '17 at 04:37
  • 1
    @Mauker The 3-sigma rule finds outliers in a statistical sense, probably not suitable for that kind of signal processing... – Amro Apr 28 '17 at 06:52
  • Thanks for the reply on such an old answer :) I asked this because I actually managed to use this as a step of a "voice activity detector". – Mauker Apr 28 '17 at 14:07
7

If it's for demonstrative purposes only, and you're not actually going to be using these scaled values for anything, I sometimes like to increase contrast in the following way:

% your data is in variable 'a'
plot(a.*abs(a)/max(abs(a)))

edit: since we're posting images, here's mine (before/after): enter image description here

hughes
  • 5,595
  • 3
  • 39
  • 55
  • Couldn't I apply a Wavelet/Fourier transform and get rid of the high frequency signals? Or it doesn't work that way? I'm a beginner at using signal transforms. – Simon Jul 29 '11 at 13:45
  • The thing is, a lot of high-frequency data is present in any sharp point. In fact, a plot that has zero noise and only the single point (i.e. a dirac delta function) will have equal magnitude on every frequency. I don't know how you could do this with a fourier transform. – hughes Jul 29 '11 at 15:01
  • Getting rid of high frequencies will not help you, because your high amplitude peaks are high frequency as well. If you use the wavelet transform, you can to amplitude thresholding instead of frequency filtering. – Phonon Jul 29 '11 at 15:03
  • I have applied your previous suggestion by using the logarithm to the data. `Data = Data .* logb(Data, abs(mean(Data) + 2 * std(Data)))`, where the second argument of the `logb` function is the logarithm base. Basically, all the elements between `mean` and `mean + 2 * std` are reduced and all the other one are increased by the logarithm factor. What do you think about this? – Simon Jul 29 '11 at 18:18
  • Could you provide a further insight on why this works? What's the math behind it? – Mauker Jan 06 '17 at 13:55
6

You might try a split window filter. If x is your current sample, the filter would look something like:

k = [L L L L L L 0 0 0 x 0 0 0 R R R R R R]

For each sample x, you average a band of surrounding samples on the left (L) and a band of surrounding samples on the right. If your samples are positive and negative (as yours are) you should take the abs. value first. You then divide the sample x by the average value of these surrounding samples.

y[n] = x[n] / mean(abs(x([L R])))

Each time you do this the peaks are accentuated and the noise is flattened. You can do more than one pass to increase the effect. It is somewhat sensitive to the selection of the widths of these bands, but can work. For example:

before

Two passes:

after

Jonathan
  • 616
  • 4
  • 7
3

What you actually need is some kind of compression to scale your data, that is: values between -2 and 2 are scale by a certain factor and everything else is scaled by another factor. A crude way to accomplish such a thing, is by putting all small values to zero, i.e.

x = randn(1,100)/2; x(50) = 20; x(25) = -15; % just generating some data
threshold = 2;
smallValues = (abs(x) <= threshold);
y = x;
y(smallValues) = 0;
figure; 
plot(x,'DisplayName','x'); hold on; 
plot(y,'r','DisplayName','y'); 
legend show;

Please do not that this is a very nonlinear operation (e.g. when you have wanted peaks valued at 2.1 and 1.9, they will produce very different behavior: one will be removed, the other will be kept). So for displaying, this might be all you need, for further processing it might depend on what you are trying to do.

enter image description here

Egon
  • 4,757
  • 1
  • 23
  • 38
2

To eliminate the low amplitude peaks, you're going to equate all the low amplitude signal to noise and ignore.

If you have any apriori knowledge, just use it.

if your signal is a, then

a(abs(a)<X) = 0

where X is the max expected size of your noise.

If you want to get fancy, and find this "on the fly" then, use kmeans of 3. It's in the statistics toolbox, here:

http://www.mathworks.com/help/toolbox/stats/kmeans.html

Alternatively, you can use Otsu's method on the absolute values of the data, and use the sign back.

Note, these and every other technique I've seen on this thread is assuming you are doing post processing. If you are doing this processing in real time, things will have to change.

John
  • 5,735
  • 3
  • 46
  • 62