2

This is what I have for the plot:

semPaths(twofac7items_b,"std","est", rotation = 2,
         style = "lisrel",nCharNodes = 0,nodeNames=nodeNames,layout = "tree2",
         filetype = "pdf", width = 8, height = 6, filename = "Two Factor",
         residScale = 20)

Looks like this:

No Title SEM Path Diagram

What I want is this:

Path Diagram With Title

This is the dput(head). Everything I have is relabeled as Anxiety and Depression, so not sure how useful this will be:

structure(list(q01 = c(2, 1, 2, 3, 2, 2), q02 = c(1, 1, 3, 1, 
1, 1), q03 = c(4, 4, 2, 1, 3, 3), q04 = c(2, 3, 2, 4, 2, 2), 
    q05 = c(2, 2, 4, 3, 2, 4), q06 = c(2, 2, 1, 3, 3, 4), q07 = c(3, 
    2, 2, 4, 3, 4), q08 = c(1, 2, 2, 2, 2, 2), q09 = c(1, 5, 
    2, 2, 4, 4), q10 = c(2, 2, 2, 4, 2, 3), q11 = c(1, 2, 3, 
    2, 2, 2), q12 = c(2, 3, 3, 2, 3, 4), q13 = c(2, 1, 2, 2, 
    3, 3), q14 = c(2, 3, 4, 3, 2, 3), q15 = c(2, 4, 2, 3, 2, 
    5), q16 = c(3, 3, 3, 3, 2, 2), q17 = c(1, 2, 2, 2, 2, 3), 
    q18 = c(2, 2, 3, 4, 3, 5), q19 = c(3, 3, 1, 2, 3, 1), q20 = c(2, 
    4, 4, 4, 4, 5), q21 = c(2, 4, 3, 4, 2, 3), q22 = c(2, 4, 
    2, 4, 4, 1), q23 = c(5, 2, 2, 3, 4, 4)), variable.labels = c(q01 = "Statistics makes me cry", 
q02 = "My friends will think I'm stupid for not being able to cope with SPSS", 
q03 = "Standard deviations excite me", q04 = "I dream that Pearson is attacking me with correlation coefficients", 
q05 = "I don't understand statistics", q06 = "I have little experience of computers", 
q07 = "All computers hate me", q08 = "I have never been good at mathematics", 
q09 = "My friends are better at statistics than me", q10 = "Computers are useful only for playing games ", 
q11 = "I did badly at mathematics at school", q12 = "People try to tell you that SPSS makes statistics easier to understand but it doesn't", 
q13 = "I worry that I will cause irreparable damage because of my incompetenece with computers", 
q14 = "Computers have minds of their own and deliberately go wrong whenever I use them", 
q15 = "Computers are out to get me", q16 = "I weep openly at the mention of central tendency", 
q17 = "I slip into a coma whenever I see an equation", q18 = "SPSS always crashes when I try to use it", 
q19 = "Everybody looks at me when I use SPSS", q20 = "I can't sleep for thoughts of eigen vectors", 
q21 = "I wake up under my duvet thinking that I am trapped under a normal distribtion", 
q22 = "My friends are better at SPSS than I am", q23 = "If I'm good at statistics my friends will think I'm a nerd"
), codepage = 65001L, row.names = c(NA, 6L), class = "data.frame")

This is the SEM Model if its necessary:

m4b <- 'Depression =~ q01+ q03 + q04 + q05 + q08
        Anxiety =~ q06 + q07' 
twofac7items_b <- cfa(m4b, data=dat,std.lv=TRUE) 
summary(twofac7items_b,fit.measures=TRUE,standardized=TRUE)
Shawn Hemelstrand
  • 2,676
  • 4
  • 17
  • 30
  • 2
    did you try `title(main = ...)`? – rawr Aug 14 '21 at 07:24
  • I tried adding that code into the semPaths code but just got error: Error in title(main = "SEM DEPRESSION") : plot.new has not been called yet – Shawn Hemelstrand Aug 14 '21 at 08:53
  • 1
    @Teufelkoenig; rawr's suggestion will work if you don't directly save to an external file. So instead use `pdf(...); semPaths(...); title("www"); dev.off()`, where `...` are the relevant parameters. – user20650 Aug 14 '21 at 12:06
  • Not sure what you mean. I put in this assuming thats what you were implying: semPaths(twofac7items_b,"std","est", rotation = 2, style = "lisrel",nCharNodes = 0,nodeNames=nodeNames,layout = "tree2", width = 8, height = 6, residScale = 20, dev.off(), title(main = "SEM DEPRESSION")) – Shawn Hemelstrand Aug 14 '21 at 12:31
  • 1
    Your code in the comment above wouldn't work as you didn't open the pdf device and added the title after you had closed it. Something along these lines should work: `pdf("output.pdf") ; semPaths(twofac7items_b,"std","est", rotation = 2, style = "lisrel",nCharNodes = 0,nodeNames=nodeNames,layout = "tree2", residScale = 20); title("SEM DEPRESSION") ; dev.off()` – user20650 Aug 14 '21 at 17:44
  • Well now it has a title and it created a pdf, but when I go to open it just wont let me now. It gives me an error like "This file is not supported or has been corrupted" in Chinese (my OS is set in Chinese, this code didn't do that haha). I tried just exporting the plot within the dropdown in R and it did the same thing. – Shawn Hemelstrand Aug 15 '21 at 01:16
  • 1
    Does this small example produce a pdf correctly: `pdf("test.pdf"); semPaths(lm(mpg ~ wt, mtcars), intAtSide=TRUE); dev.off()` – user20650 Aug 15 '21 at 13:28
  • Yeah but its now just a couple lines with some characters around them. – Shawn Hemelstrand Aug 15 '21 at 13:42
  • 1
    From your description, I'm not quite sure what you are seing. I see a graph with three nodes, for mpg, wt and the intercept. Perhaps something is not playing nice with your pdf viewer. Can you try running the code from my last comment but using a `png`; That is substitute `png("test.png")` for the `pdf` – user20650 Aug 15 '21 at 14:12
  • No, I think what you already described is what I had when I ran it as a pdf. Wish I could add a pic but its basically what I have from what I can tell. A square, "wt", and a triangle are pointing at another square, "mpg." – Shawn Hemelstrand Aug 16 '21 at 00:57

1 Answers1

1

Background

Finally, I put this to the side for some time when I got more R savvy. Instead of trying to overcomplicate things, I decided to make a really simple SEM path plot, then apply what was said in the comments here earlier to solve the issue.

Solution

So the major issue I kept having was getting the title to map on. For some reason I couldn't understand what was causing the issue...until I figured out the order of operations for printing out the plot. So here is basically what I did. First I used a well-oiled data frame and wrote a model based off the old lavaan manual:

# Write model:
model <- '
ind60 =~ x1 + x2 + x3
dem60 =~ y1 + y2 + y3 + y4
dem65 =~ y5 + y6 + y7 + y8

dem60 ~ ind60
dem65 ~ ind60 + dem60

y1 ~~ y5
y2 ~~ y4 + y6
y3 ~~ y7
y4 ~~ y8
y6 ~~ y8
'
# Fit model:
fit <- sem(model,
           data = PoliticalDemocracy)
# Summarize model:
summary(fit,
        standardized = T)

semPaths(fit,
         "std",
         "est",
         style = "lisrel",
         theme = "colorblind",
         rotation = 2,
         legend.cex = .5,
         layout = "tree2")

Now this is the main part...first, I just printed out the plot as it was from there:

No title plot

It was then that I put the title command directly after running the plot in the R plot viewer:

# Manually add title to generated plot
title("Democracy")

Title Plot

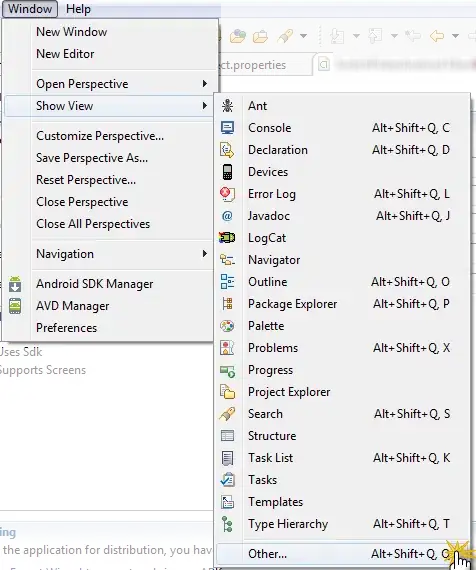
From there, I just printed the plot with this dropdown:

enter image description here

I was so new to R that I kept screwing this up by trying to output the file first. And by changing the order in my script, I got my pdf of my plot! I'm so happy that I was finally able to get this accomplished. Thank you to Rawr and User20650 for attempting to work with me on this.

Shawn Hemelstrand
  • 2,676
  • 4
  • 17
  • 30