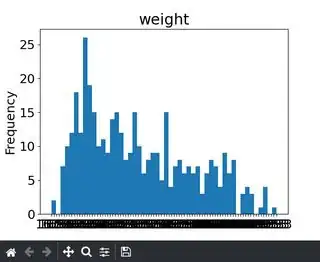
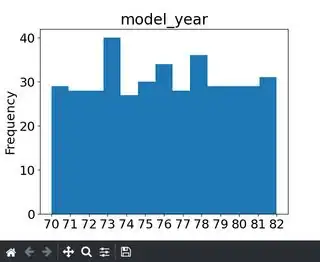
Context
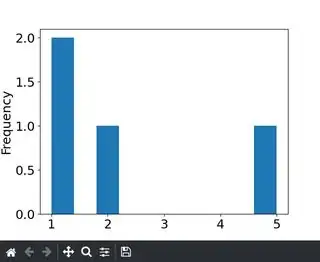
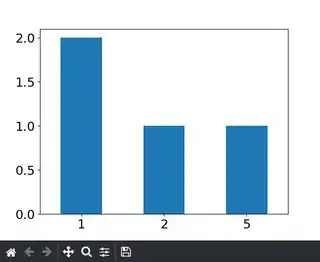
I'm trying to produce plots across a dataframe for value_counts.
I'm unable to share the dataset I've used as its work related. But have used another dataset below.
Blocker
There are 3 main issues:
- This line "plt.xticks(np.arange(min(df_num[c]),max(df_num[c])+1, aaa));" causes a
"ValueError: arange: cannot compute length. - The xticks overlap
- The xticks at times aren't at the frequency specified below
# load dataset
df = sns.load_dataset('mpg')
# subset dataset
df_num = df.select_dtypes(['int64', 'float64'])

# Loop over columns - plots
for c in df_num.columns:
            fig = plt.figure(figsize= [10,5]);
            bins1 = df_num[c].nunique()+1

#           plot
            ax = df[c].plot(kind='hist', color='orange', bins=bins1, edgecolor='w');

#           dynamic xtick frequency
            if df_num[c].nunique() <=30:
                aaa = 1
            elif 30< df_num[c].nunique() <=50:
                aaa = 3
            elif 50< df_num[c].nunique() <=60:
                aaa = 6
            elif 60< df_num[c].nunique() <=70:
                aaa = 7
            elif 70< df_num[c].nunique() <=80:
                aaa = 8
            elif 80< df_num[c].nunique() <=90:
                aaa = 9
            elif 90< df_num[c].nunique() <=100:
                aaa = 10
            elif 90< df_num[c].nunique() <=100:
                aaa = 20
            else:
                aaa = 40

#           format plot
            plt.xticks(np.arange(min(df_num[c]),max(df_num[c])+1, aaa));
            ax.set_title(c)
@Cimbali
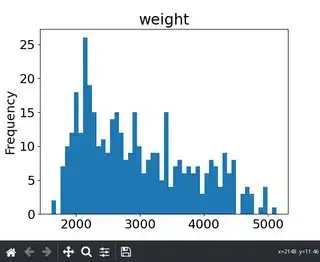
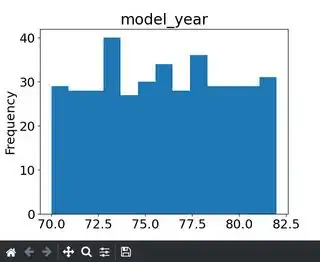
The ticks are at times at the edgepoint and other times partly in bin.
Is it possible to have one or the other?

