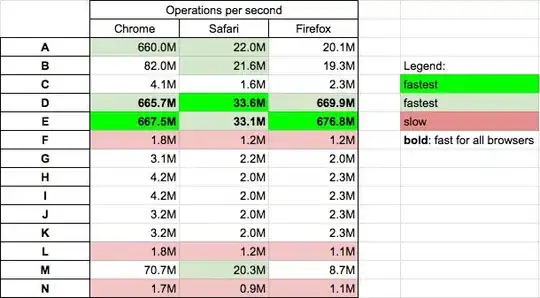
Given the following table (borrowed from here):
import numpy as np
import pandas as pd
import matplotlib.pyplot as plt

fig, ax = plt.subplots()

fig.patch.set_visible(False)
ax.axis('off')
ax.axis('tight')
df = pd.DataFrame(np.random.randn(10, 4), columns=list('ABCD'))
ax.table(cellText=df.values, colLabels=df.columns, loc='center')
fig.tight_layout()
plt.show()
I want to hide all lines save for those horizontal under each row (but not the bottom or top 2 rows). Is this level of control attainable? I tried ax.hlines, but the lines seemed to plot randomly.
