I am making a shiny application where the user specifies the independent variables and as a result shiny displays a time series plot with plotly, where on-however each point shows the selected parameters.
If I know the exact number of variables that the user selects, I am able to construct the time series plot without a problem. Let's say there are 3 parameters chosen:
ggp <- ggplot(data = data.depend(), aes(x = Datum, y = y, tmp1 = .data[[input$Coockpit.Dependencies.Undependables[1]]], tmp2 = .data[[input$Coockpit.Dependencies.Undependables[2]]], tmp3 = .data[[input$Coockpit.Dependencies.Undependables[3]]])) +
     geom_point()
ggplotly(ggp)
where data.depend() looks like

and the selected parameters are stored in a character vector 
So the problem is that for each parameter I want to include in the tooltip, I have to hard code it in the aes function as tmpi = .data[[input$Coockpit.Dependencies.Undependables[i]]]. I would however like to write generic function that handles any amount of selected parameters. Any comment suggestions are welcome.
EDIT: Below a minimal working example:
data.dummy <- data.frame(Charge = c(1,2,3,4,5), Datum = c(as.Date("2020-01-01"),as.Date("2020-01-02"),as.Date("2020-01-03"),as.Date("2020-01-04"),as.Date("2020-01-05")), y = c(4,5,6,4,5), ZuluftTemperatur = c(52,51,54,58,49), Durchflussgeschwindigkeit = c(690, 716,722,710,801), ZuluftFeuchtigkeit= c(3.9,4.1,3.8,3.0,4.9))
ChosenParams <- c("ZuluftTemperatur", "ZuluftFeuchtigkeit", "Durchflussgeschwindigkeit")
ggp <- ggplot(data = data.dummy, aes(x = Datum, y = y,  tmp1 = .data[[ChosenParams[1]]], tmp2 = .data[[ChosenParams[2]]], tmp3 = .data[[ChosenParams[3]]])) + geom_point()
ggplotly(ggp)
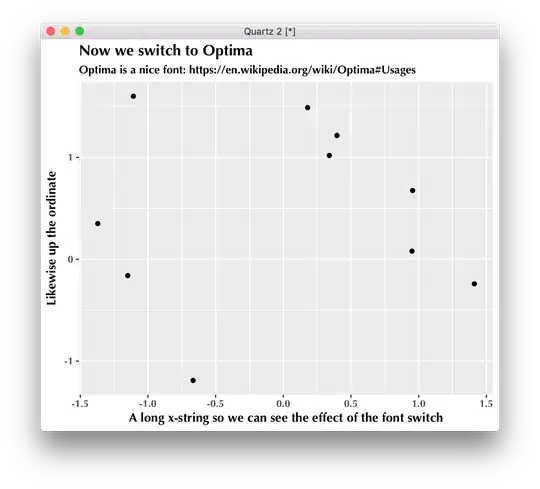
Result:
So this works at the "cost" of me knowing the user is choosing three parameters and therefore I write in aes tmpi = .data[[ChosenParams[i]]]; i=1:3. I am interested in a solution with the same result but where I don't have to write tmpi = .data[[ChosenParams[i]]] i-number of times
Thank you!


