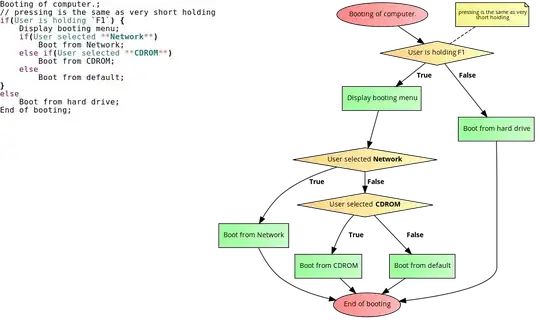
Is it possible to remove the empty grey boxes (highlighted inside red circle) present to the right side of the decomposed plots (attached)?
Also, it is possible to change the title fonts (highlighted inside green circle) of the individual to Times New Roman or any other fonds of choice?
The r code used for creating the plot is as below
autoplot(decompose(x, type = "additive"))+labs(y=expression(Chl[a]~(µg/L)), x="Year") + ggtitle(expression(Decomposed~Chl[a]~Time~Series~BB1)) + theme(plot.title=element_text(hjust=0.5))
time series- decomposed plots