I have created a 3d map using rgl.surface(), mainly following Shane's answer in this post. Using my own data, I get this map

On top of this surface map, I would like to add a map of vegetation density such that I obtain something like this (obtained with the software Surfer):
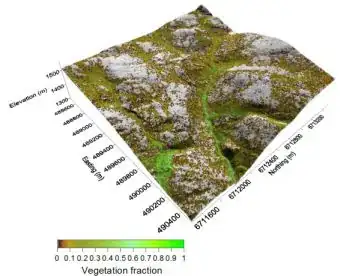
Is it possible to do this with rgl, or for that matter any other package in r or is the only solution to have two maps like in Shane's answer?
Thank you.
Edit:
Following @gsk3's request, here is the code for this map:
library(rgl)

# Read the z (i.e. elevation) dimension from file
z1 = matrix(scan("myfile.txt"),nrow=256, ncol=256, byrow=TRUE)
#create / open x y (i.e. easting and northing coordinates) dimensions
y=8*(1:ncol(z)) # Each point is 8 m^2
x=8*(1:nrow(z))

# See https://stackoverflow.com/questions/1896419/plotting-a-3d-surface-plot-with-contour-map-overlay-using-r for details of code below
zlim <- range(z)
zlen <- zlim[2] - zlim[1] + 1
colorlut <- terrain.colors(zlen,alpha=0) # height color lookup table
col <- colorlut[ z-zlim[1]+1 ] # assign colors to heights for each point
open3d()
rgl.surface(x,y,z)
I can't post the elevation code because there are 65536 (i.e. x*y=256*256) points but it is a matrix which looks like this
            [,1]     [,2]     [,3]     [,4]     [,5]
[1,]    1513.708 1513.971 1514.067 1513.971 1513.875
[2,]    1513.622 1513.524 1513.578 1513.577 1513.481
and so on. Same for the vegetation density map, which is exactly the same format and for which I have a single value for each x*y point. I hope this makes things a bit clearer...?
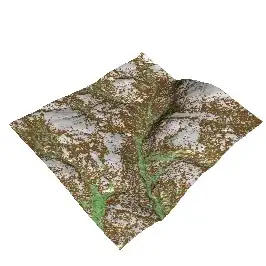
Edit 2, final version
This is the map I have produced with R. I haven't got the legend on it yet but this is something I'll do at a later stage.
The final code for this is
library(rgl)
z1 = matrix(scan("myfile.txt"),nrow=256, ncol=256, byrow=TRUE)
# Multiply z by 2 to accentuate the relief otherwise it looks a little bit flat.
z= z1*2

#create / open x y dimensions
y=8*(1:ncol(z))
x=8*(1:nrow(z))

trn = matrix(scan("myfile.txt"),nrow=256, ncol=256, byrow=TRUE)
fv = trn*100
trnlim = range(fv)

fv.colors = colorRampPalette(c("white","tan4","darkseagreen1","chartreuse4")) ## define the color ramp
colorlut =fv.colors(100)c(1,seq(35,35,length.out=9),seq(35,75,length.out=30),seq(75,100,length.out=61))]

# Assign colors to fv for each point
col = colorlut[fv-trnlim[1]+1 ]
open3d()
rgl.surface(x,y,z,color=col)
Thank you very much to @gsk3 and @nullglob in this post for their help. Hope this post will help many others!