51

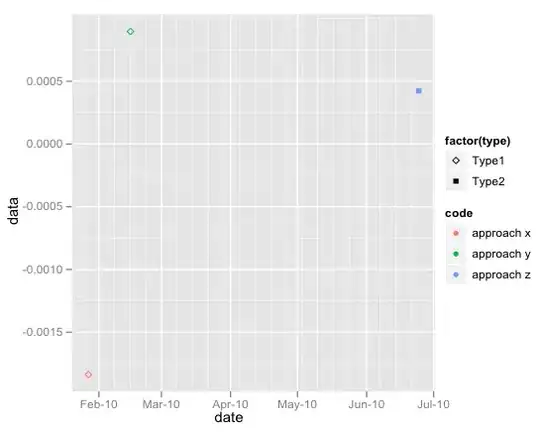
I have two legends on my ggplot with two different legend titles (automatically created from ggplot()). Now, I want to change this legend titles. + labs(colour = "legend name") only change the second legend title. How can I change the first one, too?

Sample data:

dataset <- structure(list(date = structure(c(1264572000, 1266202800, 1277362800), 
class = c("POSIXt", "POSIXct"), tzone = ""), 
x1 = c(-0.00183760994446658, 0.00089738603087497, 0.000423513598318936), 
x2 = c("approach x","approach y","approach z"), 
x3 = c("Type1", "Type1", "Type2")) ,
.Names = c("date", "data","code","type"),
row.names = c("1", "2", "3"), class = "data.frame")

Here is my code to produce the plot:

p <- ggplot(dataset, aes(x=date, y=data)) +
geom_point(aes(shape = factor(type), color = code)) +
scale_shape_manual(value=c(23,15))
print(p)

The legend titles are on default: "factor(type)" and "code": enter image description here
Andrew
  • 9,090
  • 8
  • 46
  • 59
Atticus
  • 783
  • 2
  • 6
  • 13
  • 2
    You don't provide sample data, resulting in not reproducible code. It will be much easier to help you if you provide sample data and code that we can reproduce. – Andrie Aug 02 '11 at 11:11

2 Answers2

85

Here is an example using the iris dataset:

data(iris)
ggplot(iris, aes(x=Sepal.Length, y=Sepal.Width)) +
    geom_point(aes(shape=Species, colour=Petal.Width)) + 
    scale_colour_gradient() +
    labs(shape="Species label", colour="Petal width label")

You specify the labels using labs(), with each scale separately specified, i.e. labs(shape="Species label", colour="Petal width label").

enter image description here

Andrie
  • 176,377
  • 47
  • 447
  • 496
  • 2
    You can specify the labs in via scale() too ggplot(iris, aes(x=Sepal.Length, y=Sepal.Width)) + geom_point(aes(shape=Species, colour=Petal.Width)) + scale_colour_gradient("Petal width label") + scale_shape("Species label") – Thierry Aug 02 '11 at 11:45
  • Thank you, Its working. I have a further question: I have many entrys in **code** (see my example), so in the plot there are many colors. Now, for example I want color only "approach z" black, and leave the other unchanged (they are colored automatically). For this, the following code doesn´t work: `+ scale_colour_manual(values = c("approach z" = "black"))` – Atticus Aug 02 '11 at 11:52
  • @pmuench Have a look at the examples in the documentation for `scale_manual` at http://had.co.nz/ggplot2/scale_manual.html – Andrie Aug 02 '11 at 11:59
  • @Andrie I have, but they replace all of the colors. I want only replace one and leave the other (automatic colored) unchanged. – Atticus Aug 02 '11 at 12:10
  • 1
    That question has been asked before: http://stackoverflow.com/questions/6075140/in-r-how-do-i-change-the-color-value-of-just-one-value-in-ggplot2s-scale-fill-br/6075772#6075772 – Andrie Aug 02 '11 at 12:42
  • Thanks for this answer @Andrie, is there a way to change the legend text labels in the second legend? I can change the title, but I'd like to change the names of the labels (e.g. setosa and versicolor in your above example) – cgxytf Jun 17 '21 at 20:58
15

If I understood your point correctly, you can simply use + labs(shape = "shape legend title", colour = "colour legend title")

Jean-Robert
  • 840
  • 6
  • 10