This is continuation from the post.
When adding a secondary y-axis, from the code attached at the end of this thread, it produced
However, the generated secondary y-ticks value is not align with the horizontal line marker. This, may confuse potential reader that try to understand this figure.
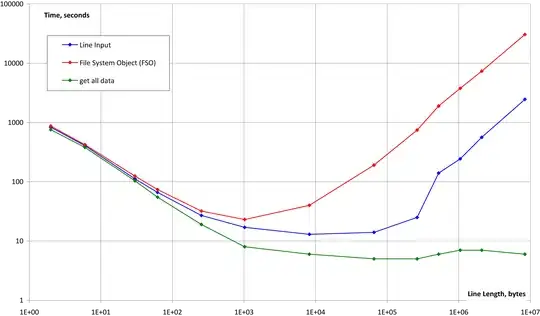
May I know, how to control the secondary y-ticks value so that, it can produced something as in this figure
Notice that, the main and secondary y-axis value were scaled and align nicely. Also, this nicely present the scaling between the two y-axis.
import numpy as np
import matplotlib.pyplot as plt
x, y = np.random.random((2,50))
fig, ax = plt.subplots()
ax.scatter(x, y*10, s=50, cmap='viridis')
ax.set_xlabel('X1_z')
ax.set_ylabel('x1_y')
ax.set_title('Adding secondary y-axis')
def a2b(y):
    return y/2.5
def b2a(y):
    return 2.5*y
secax = ax.secondary_yaxis('right', functions=(a2b,b2a))
secax.set_ylabel('x2_y')
plt.show()

