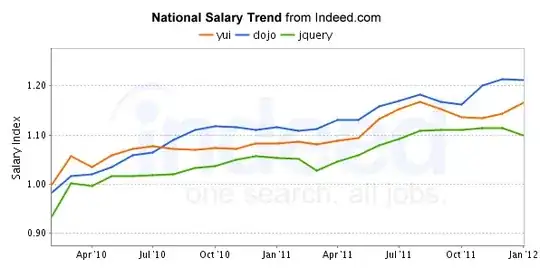
I'm trying to add the curves name to my ggplot directly from the legend.
Here's my code
plott = ggplot(PL2, aes(P, growth.rate2020, color=Country, showlabels=TRUE)) +
    geom_point()
What I want to see is the name of each country next to each curve

