1

I'm trying to use visual studio performance profiler for the first time and I'm interested in a specific function of mine which is successfully detected by the profiler. However, when I click on it I get "Source information is not available" .

How do I fix this?

enter image description here

All external functions from libraries are visible. Any function that is in "lab.cpp" won't show. I mean, not even "main" is available. This is the only file I edit, I write all my code in there:

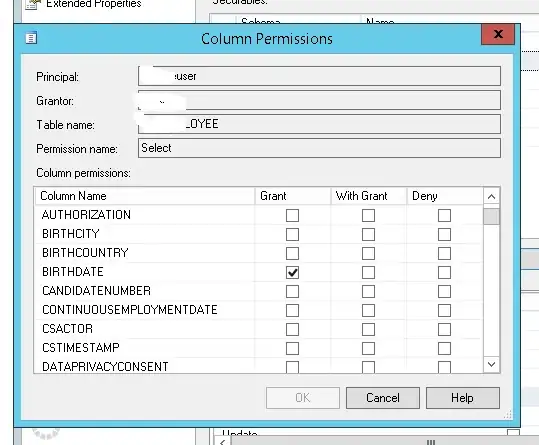
enter image description here

Jeaninez - MSFT
  • 3,210
  • 1
  • 5
  • 20
John Katsantas
  • 571
  • 6
  • 20
  • The first step would be to make sure that the executable is exactly up to date with the source files. You can try to rebuild everything. You may have a compilation error you didn't notice, and you may be profiling an outdated build. – François Andrieux Sep 21 '21 at 19:44
  • @FrançoisAndrieux Well, I'm clueless so I'll mention everything. I just write my code and hit "Local windows debugger" in release mode. That's all I ever do in VS. I tried "rebuild solution" right now if that's what you mean. Still the same error. – John Katsantas Sep 21 '21 at 19:49

3 Answers3

5

In case someone else has the same problem, I solved it by setting the "Debug Information Format" which was previously empty in my cpp file's(the file containing the functions) General Properties:

enter image description here

John Katsantas
  • 571
  • 6
  • 20
  • 1
    Great, please remember to accept your answer as this will help other forum members, and thank you for sharing the solution. – Tianyu Sep 27 '21 at 07:18
0

The accepted answer for this question says that you just need to add a Debug Information Format in Release, for me doing this was not enough. I needed to add a Debug Information Format and turn on "Generate Debug Info" in Release.

I recommend creating a new configuration called "Release with Debug Info" using the Configuration Manager (which you can get to from the Configuration combobox/dropdown), copying the settings from "Release" into "Release with Debug Info" and then making the two changes documented in this answer in the new configuration.

jwezorek
  • 8,592
  • 1
  • 29
  • 46
0

My issue is for C# using the CPU usage within the Performance Profiler.

On the solution, right click on the Solution. On the context menu select Properties. The Solution Property modal should appear. Within Common Properties > Debug Source Files add any local Debug folders.

enter image description here

Run the Performance Profiler. On CPU Usage overview with Current View: Functions, right click desired module to bring up the context menu. "Load All Symbols". This brought up the code and percentages as expected.

enter image description here

Esaith
  • 706
  • 9
  • 12