1

This is probably a duplicate question but I am really desperate here as I have tried to set up the debugger in my PhpStorm. If someone can point me in the correct direction, I really appreciate that.

I am using XAMPP Apache server on Windows 10 and my IDE is PhpStorm.

Here are my php.ini Xdebug lines:

[XDebug]
zend_extension=xdebug
xdebug.mode=debug,develop
xdebug.start_with_request=trigger
xdebug.idekey=PHPSTORM

And this is how I have set up my virtual hosts:

<VirtualHost *:80>
    DocumentRoot "C:\xampp\htdocs\dev\myproject"
    ServerName www.myproject.local
    <Directory "C:\xampp\htdocs\dev\myproject">
        Allow from all
        Require all granted
    </Directory>
</VirtualHost>

Here is my CLI Interpreter in the below image:
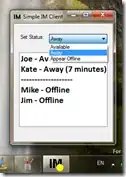
enter image description here

This is my Debugger settings:
enter image description here

And following is my Server settings in PhpStorm: enter image description here

I am aware that in CLI Interpreters, it displays Debugger: Xdebug 3.0.4b but the debugger does not stop in the breakpoints. And It does not spit out any errors.

I am not sure what else to try if someone can point me in the correct direction it will be a great help. Thanks

Update: Following is my phpinfo() xDebug section. enter image description here
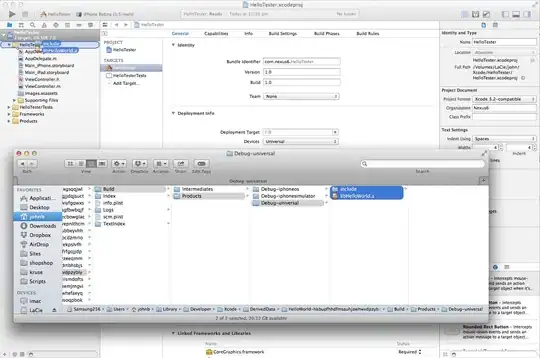
Following is how I am trying to set up the breakpoint and debug. enter image description here

Dula
  • 1,276
  • 5
  • 14
  • 23
  • How are you starting the debugging session? With a browser extension, or by clicking around in PhpStorm, or something else? – Derick Oct 01 '21 at 13:08
  • Clicking on the left side (where line numbers are) and setting the break points. – Dula Oct 01 '21 at 13:37
  • @Dula *"Clicking on the left side (where line numbers are)"* Well, that is just setting up the breakpoint. How do you actually debug? What and where do you click to load your page/start the debugger/debugging your request? I suggest you check these links first: 1) https://learnxdebug.com/ 2) https://www.jetbrains.com/phpstorm/documentation/debugging/ 3) https://www.jetbrains.com/help/phpstorm/debugging-with-phpstorm-ultimate-guide.html – LazyOne Oct 01 '21 at 14:39
  • 1) I suggest you enable Xdebug log, restart server (so PHP gets the new config) and try to debug -- will Xdebug write anything there? 2) What are your live Xdebug config captured via browser on that site (`xdebug_info()` output or the whole Xdebug section of the `phpinfo()`) – LazyOne Oct 01 '21 at 14:47
  • @LazyOne - I updated the question with my ``phpinfo()`` xDebug section output and a screenshot from my IDE. To debug, I am navigating to ``www.myproject.local/admin/dashboard`` from the browser which executes this controller method. – Dula Oct 02 '21 at 06:17
  • @Dula Great. So what do you use to send "debug this request" flag? A Xdebug browser extension (that set the Xdebug cookie)? Or is it something else? Your Xdebug config looks OK at quick glance (the few key params that I've checked). Basically, you are using "zero config" debug (how JetBrains calls it): https://www.jetbrains.com/help/phpstorm/zero-configuration-debugging.html If you do this correctly and have Xdebug log enabled (which you do not) then it should write what is happening into the log. – LazyOne Oct 02 '21 at 09:25
  • Anyway; try placing the `xdebug_break();` where you want to debug -- will it break there? What Xdebug log says about it? – LazyOne Oct 02 '21 at 09:27

0 Answers0