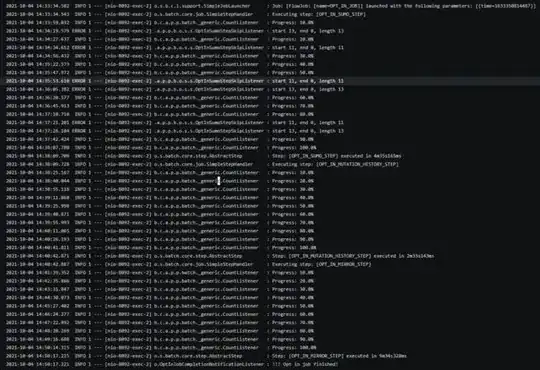
I'm dealing with a serious memory issue in Spring Batch which is a worrisome issue.
The flow is simple: read from Oracle, convert to another object type, and write it back to another table. It concerns 200k records.
I tried both HibernateCursorItemReader and RepositoryItemReader.
My job executes the following step:
@Bean
public Step optInMutationHistoryStep() {
    return stepBuilderFactory
            .get(STEP_NAME)
            .<BodiCmMemberEntity, AbstractMutationHistoryEntity> chunk(5)
            .reader(optInItemReader)
            .processor(optInMutationHistoryItemProcessor)
            .writer(mutationHistoryItemWriter)
            .faultTolerant()
            .skipPolicy(itemSkipPolicy)
            .skip(Exception.class)
            .listener((StepExecutionListener) optInCountListener)
            .build();

}
Reader:
@Component
public class OptInItemReaderTest extends RepositoryItemReader<BodiCmMemberEntity> {

    public OptInItemReaderTest(BodiCmMemberRepository bodiCmMemberRepository){
        setRepository(bodiCmMemberRepository);
        setMethodName("findAllOptIns");
        setPageSize(100);
        Map<String, Sort.Direction> sort = new HashMap<>();
        sort.put("member_number", Sort.Direction.ASC);
        setSort(new HashMap<>(sort));
    }

}
Processor:
@Component
@StepScope
public class OptInMutationHistoryItemProcessor implements ItemProcessor<CmMemberEntity, AbstractMutationHistoryEntity> {

    Long jobId;

    @BeforeStep
    public void beforeStep(StepExecution stepExecution){
        jobId = stepExecution.getJobExecutionId();
    }

    private final MutationHistoryBatchFactory mutationHistoryFactory;

    public OptInMutationHistoryItemProcessor(MutationHistoryBatchFactory mutationHistoryFactory) {
        this.mutationHistoryFactory = mutationHistoryFactory;
    }

    @Override
    public AbstractMutationHistoryEntity process(CmMemberEntity cmMemberEntity){
        return mutationHistoryFactory.addMutationHistoryEntity(cmMemberEntity, jobId, OPT_IN);
    }
}
Itemwriter:
@Component
public class MutationHistoryItemWriter extends RepositoryItemWriter<AbstractMutationHistoryEntity>{

    public MutationHistoryItemWriter(MutationHistoryRepository mutationHistoryRepository) {
        setRepository(mutationHistoryRepository);
    }
}
The factory method that I use in the processor:
public AbstractMutationHistoryEntity addMutationHistoryEntity(CmMemberEntity cmMemberEntity, Long jobId, JobType jobType) {
    return mutationHistoryEntityBuilder(cmMemberEntity, jobId, jobType, MutationType.ADD)
            .editionCode(cmMemberEntity.getPoleEditionCodeEntity().getEditionCode())
            .firstName(cmMemberEntity.getFirstName())
            .lastName(cmMemberEntity.getLastName())
            .streetName(cmMemberEntity.getStreetName())
            .houseNumber(cmMemberEntity.getHouseNumber())
            .box(cmMemberEntity.getBox())
            .postalCode(cmMemberEntity.getPostalCode())
            .numberPieces(DEFAULT_NUMBER_PIECES)
            .build();
}
I don't see immediate references held in memory, not sure what causes the rapid memory increase. It doubles quickly.
Intuitively I feel the problem is either that the retrieved resultset isn't regularly flushed, or the processor leaks somehow, but not sure why since I don't hold references to the objects that I create within the processor.
Any suggestion?
Edit:
My full job looks as follows:
@Bean
public Job optInJob(
        OptInJobCompletionNotificationListener listener,
        @Qualifier("optInSumoStep") Step optInSumoStep,
        @Qualifier("optInMutationHistoryStep") Step optInMutationHistoryStep,
        @Qualifier("optInMirrorStep") Step optInMirrorStep) {
    return jobBuilderFactory.get(OPT_IN_JOB)
            .incrementer(new RunIdIncrementer())
            .listener(listener)
            .flow(optInSumoStep)
            .next(optInMutationHistoryStep)
            .next(optInMirrorStep)
            .end()
            .build();
}
In the first step, the same itemreader is used to write records to an XML. In the second step, the step as initially shared is executed.
In OpenShift it's pretty clear that nothing gets cleaned up, and I don't hold any references afaik; I wouldn't know why I would:
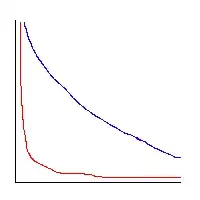
It is pretty clear that the consumption does flatten after a while, but ik keeps rising, it never goes down. After the first step (around 680Mb), I would have assumed it would have. Even more, I would expect the curve to go flat during the first step as well; after increasing chunk size to 100, memory should get released each 100 processed chunks.
The HibernateCursorItemReader is pretty disastrous; it rose already to 700Mb during the first step. The repositoryItemWriter seems to perform better. Maybe there's a reason for it, but I'm not clear which one it is.
I can't say right now if anything will get cleaned up after the job; as it processes 200k records, it takes some time and I assume it will run out of memory again before it finishes.
I'm concerned we won't be ready for production if we don't manage to solve this problem.
Edit 2:
Interestingly, the curve has flattened to the point where memory consumption doesn't increase in step 2. It's interesting; I couldn't currently tell why that is 'now'.
Current hope / expectation is that step 3 doesn't increase memory consumption, and that the memory gets cleaned up after the job has finished. It does appear that the insert speed has drastically slowed down. I estimate by a factor of 3 (about 110k records in the second step).
Edit 3: Applying flush on the itemwriter didn't do anything to either the reducing memory consumption or speed:
Actually it's running straight for my limits this time, however I can't explain it:
You can clearly see how the process slows down tremendously, for just reading, transforming, writing records.
I have currently no idea why, but for a batch application I don't think this is acceptable behavior for us to move this to production. After two batch runs it would just go stale.
