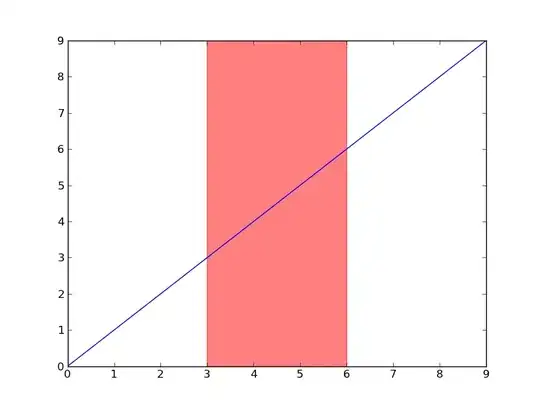
There are multiple plots stacked over one another. The ticks on x axis for each plot starts from 184.0 Are there any possible way to start my x ticks from origin with value 184.0 itself?
#create a figure and edit size
fig=plt.figure(figsize=(20,17))

#define subplots and define their position
plt1=fig.add_subplot(611)
plt2=fig.add_subplot(612)
plt3=fig.add_subplot(613)
plt4=fig.add_subplot(614)
plt5=fig.add_subplot(615)
plt6=fig.add_subplot(616)


plt1.plot("DOY", "By", data=df,color='black')
plt1.set_ylabel("By",size=16)
plt1.set_title("3-6 July 2003",size=20)
plt1.get_yaxis().set_label_coords(-0.05,0.5)

plt2.plot("DOY", "Bz", data=df,color='black')
plt2.set_ylabel("Bz",size=16)
plt2.get_yaxis().set_label_coords(-0.05,0.5)

plt3.plot("DOY", "Vsw", data=df,color='black')
plt3.set_ylabel("Vsw",size=16)
plt3.get_yaxis().set_label_coords(-0.05,0.5)

plt4.plot("DOY", "Nsw", data=df,color='black')
plt4.set_ylabel("Nsw",size=16)
plt4.get_yaxis().set_label_coords(-0.05,0.5)

plt5.plot("DOY", "reconnection_rate", data=df,color='black')
plt5.set_ylabel("MRR",size=16)
plt5.get_yaxis().set_label_coords(-0.05,0.5)

plt6.plot("DOY", "magnetopause_distance", data=df,color='black')
plt6.set_ylabel("MD",size=16)
plt6.set_xlabel("Day of Year",size=16)
plt6.get_yaxis().set_label_coords(-0.05,0.5)

#plt.subplots_adjust(hspace =  ,wspace = 5)
#saving plot in .jpg format
plt.savefig('3 to 6 July 2003 plot.jpg', format='jpeg',dpi=None, edgecolor='black', transparent=True, bbox_inches='tight')
UPDATE:
After trying plt.margins(x=0)
I am getting something like this


