12

I'm trying to track down some bugs, and one of them is related to a memory leak. It's an object that I can tell that something still has a reference to, since Instruments still shows it as being alive, but Instruments does not register it as a leak.

Is there anyway to look at an instance of an object in Objective-C and see what other objects still have a reference to that object?
Josh Buhler
  • 26,878
  • 9
  • 29
  • 45

3 Answers3

8

I would recommend using the Allocations/ObjectAllocations Instruments template and then in the top right corner type the class name of your object (in the Category field).

You can then see the allocations increasing as you suggest and by viewing the extended detail you can see where they were allocated.

All content below this point was added by the OP (joshbuhler)

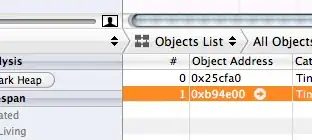
In the screenshot below, change the filter to "Objects List", and then by clicking on the little arrow to the right of the object's address, the history of memory events (alloc/retain/release/dealloc) will be show for that object. It won't show you exactly what is hanging onto that object, but it will give you some very useful info for tracking it down.

enter image description here

Community
  • 1
  • 1
InsertWittyName
  • 3,930
  • 1
  • 22
  • 27
2

Cautionary Tail: :) In the process of searching for a memory leak, I set a breakpoint (really a logpoint) in Xcode that would log the value of self when it was triggered troublesome logpoint image. Meanwhile I found the leak and patched it, but the memory usage wasn't leveling out, and my de-init was never getting called. The logpoint I set earlier was actually causing the retain count of my object to increase, and in turn that prevented de-init from ever getting called. I happened to discover this after several hours of wild goose chases which culminated in me stepping through my object's methods line by line, issuing p CFGetRetainCount(self) from debug console. When I stepped over the line with the logpoint, the retain count went up. At first I assumed it was some strange side effect of my code. I moved that logpoint so that I could set a normal breakpoint on that line, and my problem moved with it. I disabled the logpoint and the leak was gone. Hopefully this can help someone else.

Cortis Clark
  • 169
  • 1
  • 5
  • please include the image in your answer rather than using a link – Ibo Oct 11 '17 at 02:16
  • 1
    @lbo Nice idea, but Stack Overflow created the link. It gave me some warning which I didn't have a chance to fully read. It said something about the fact that I'm not allowed to embed images yet and I had to get some "points" first. – Cortis Clark Oct 12 '17 at 19:50
0

If you're using xCode you can use the Performance tools to find the memory leaks. That will give you a nice graph of ALL memory allocation and if they are released or leaked.

xcode -> run -> Start with Performance Tools -> Leaks.

Memory leak detection tools

Community
  • 1
  • 1
Matt
  • 1,265
  • 1
  • 16
  • 24
  • I am running Xcode, along with Instruments (comes with Xcode now), and the tools don't register this object as a leak. It shows me that something is still hanging on to the object in question, just not what. – Josh Buhler Aug 08 '11 at 21:44
  • sometimes there are leaks that you cant control - make sure your "Extended Detail View" is turned on and you should be able to see what all variables are created, where they are used, and so forth. – Matt Aug 08 '11 at 21:50