0

I am working on a repeated measures graph and I cannot seem to get it all working. This is my code

gg.base <- ggplot(consumption.data, aes(x = Trial, y = Consumption))
gg.idline <- gg.base + geom_line(aes(color = Id, group = Id))
gg.idline

and my output gives me this error message

Error in FUN(X[[i]], ...) : object 'Id' not found

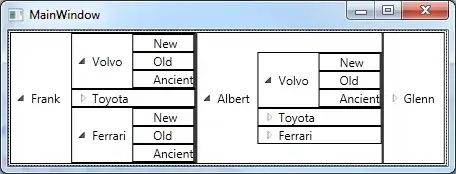
I am willing to try a different code all together but my ultimate goal is a graph similar to the attached picture.

r2evans
  • 141,215
  • 6
  • 77
  • 149
  • FYI, please read https://stackoverflow.com/editing-help and https://meta.stackexchange.com/a/22189. Code blocks use either 4-space indentation or the code "fences" (triple backticks `\`\`\``), but the fences themselves must be on a line of their own, no code before or after it. The only exception to this is to add a code-hint on the opening code fence, such as using `\`\`\`r`, though not required (and often inferred/guessed by the Stack interface). In your case, the first line of code `\`\`\`gg.base <- ...` was not showing. Fixed. – r2evans Nov 10 '21 at 14:00
  • Hi Kaiya. Can you double check that you have a column called `Id` in your data frame `consumption.data` ? Is it perhaps `ID` or `id` - remember R's variable names are case sensitive. – Allan Cameron Nov 10 '21 at 14:01
  • 1
    Does `names(consumption.data)` include `"Id"`? Please [edit] your question and post the output (in a code block) of `dput(x)`, where `x` is a representative sample of your data. In cases like these, we really need at least a few each of "time", "Treatment", and "Id", and unused columns do not need to be included. BTW, it appears that your image is including `facet_*` but your code does not. It really helps when the question is [reproducible](https://stackoverflow.com/q/5963269). Thanks! – r2evans Nov 10 '21 at 14:03
  • It was an issue with my dataframe I was calling from I just couldn't figure that out. Thank you!! I got the facet_* working as well I just was working step by step :) – Kaiya Burton Nov 10 '21 at 16:49

0 Answers0