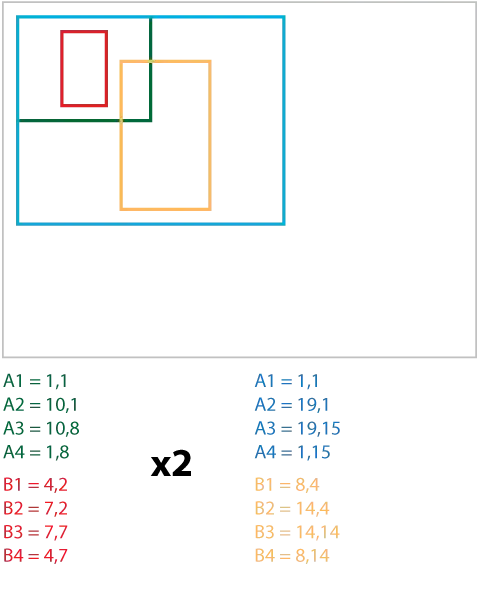
There are many questions related to adding an image to a plot. However, in all these questions the data plotted on top of the image has the same size. For example, in this question, the scatter point are plotted directly into the picture coordinates.
What I need is something else. I have the following data (example) and the following images that I wish to combine:
fig, axes = plt.subplots(1,3, figsize=(15,6), sharey=True)
axes = axes.flatten()

for ax in axes:
    x = [1,2,3,4,5]
    y = x
    ax.bar(x,y)
fig, axes = plt.subplots(1,3, figsize=(15,6), sharey=True)
axes = axes.flatten()

for ax, im in zip(axes,images):
    ax.imshow(im, alpha=0.5)
Now, if I try to plot the bars and the images unto the same axis, the bars will be so small as to be invisible. See for example the effect of set_xticks.
for ax, im in zip(axes,images):
    x = [1,2,3,4,5]
    y = x
    ax.bar(x,y)
    ax.set_xticks([1,2,3,4,5])
    ax.imshow(im, alpha=0.5)
Question:
How can I plot the data on top of the images? I tried it with a twinx but I couldn't get that working properly.
I tried to rescale the data to fit the size of the images.
def scale_data(data, size):
    return [int(x/max(data)*size) for x in data]
But the imshow function also flips the y-axis. Now, I can flip the image first, then flip the y-axis myself again, rescale all the data so it fits onto the images and then set the proper width of the bars, however this all feels much to complex and I assume there is a much simpler solution that I am simply missing.
What is the best way to achieve the desired behavior?


