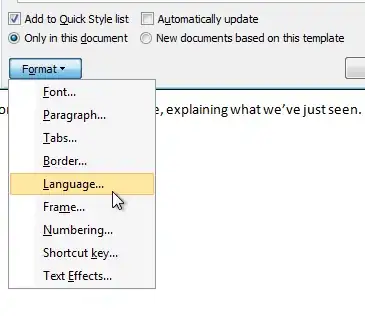
I would like to change the x-axis text format into something like this:
I would like to avoid ggplot and do it with basic 'barplot'
Any suggestion?
Here is my code
df <- data.frame(DK= c("08-01","08-11","08-21","09-01","09-11","09-21","10-01","10-11","10-21","11-01","11-11","11-21","12-01","12-11","12-21","01-01","01-11","01-21","02-01","02-11","02-21","03-01","03-11","03-21","04-01","04-11","04-21","05-01","05-11","05-21","06-01","06-11","06-21","07-01","07-11","07-21"),
                 value=c(3.9,4.4,5.1,7.1,6.1,7.0,7.8,11.3,13.5,19.6,24.9,27.5,28.0,28.6,41.0,34.3,45.1,43.7,36.0,41.6,27.2,34.3,18.6,24.0,14.0,13.7,12.3,8.5,7.4,6.5,6.2,5.2,5.9,6.3,6.2,7.1))
df

toplot <- df
options(repr.plot.width=6, repr.plot.height=4)
minv <- min(toplot[,2])-10
maxv <- max(toplot[,2])+10
label <- paste(rep(month.abb[seq(1,12,1)], each = length(c('d1','d2','d3'))), c('d1','d2','d3'))
a <-barplot(toplot$value,
            names=label,
            col='deepskyblue3',
            xaxt = "n", yaxt = "n",
            ylim=c(0,maxv),
            cex.lab=0.75
)
axis(1, cex.axis=0.55, las=2, at=a, labels=label)
axis(2, las='2', cex.axis=0.6)

