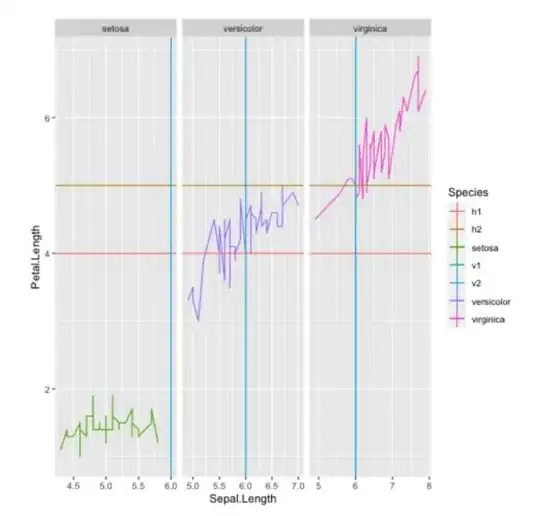
I have a problem with creating ggplot2 with multiple line guides. The issue I'm facing is how to add multiple guides for linetype. As you can conduct from the code, I'm adding group-coloured line and multiple hline/vline. geom_line has meaningful legend by default but I struggle with extra hline and vline.
ggplot2 default
library(ggplot2)
library(ggnewscale)
gg <- ggplot(iris, aes(x = Sepal.Length, y = Petal.Length)) +
    geom_line(aes(group=Species, color = Species)) +
    facet_grid(.~Species)

hor <- data.frame(yintercept = c(4, 5), guide = factor(c("h1", "h2")))
vert <- data.frame(xintercept = 6, guide = factor("v1"))

gg +
  geom_hline(aes(yintercept = yintercept, colour = guide), data = hor, show.legend = TRUE, linetype = "solid") +
  geom_vline(aes(xintercept = xintercept, colour = guide), data = vert, show.legend = TRUE, linetype = "solid")
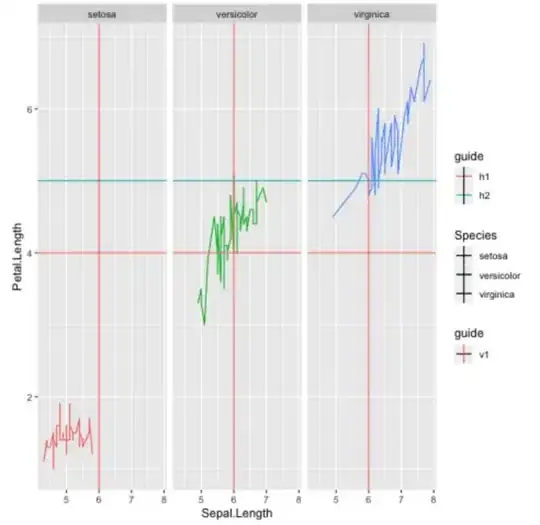
edit: Thanks to @Henrik's comment I was able to make a little progress on adding a new legend. It's almost ideal but I'm not able to change the orientation of the described lines
ggnewline with new_scale_color
gg +
  new_scale_color() +
  geom_hline(aes(yintercept = yintercept, colour = guide), data = hor, show.legend = TRUE, linetype = "solid") +
  scale_color_manual(name="Horizontal lines", values = c("red","darkred")) +
  new_scale_color() +
  geom_vline(aes(xintercept = xintercept, colour = guide), data = vert, show.legend = TRUE, linetype = "solid") +
  scale_color_manual(name="Vertical lines", values = "green")
ggnewline with new_scale("linetype")
Also adding new_scale("linetype") along with guides didn't make a trick
gg +
  new_scale("linetype") +
  geom_hline(aes(yintercept = yintercept, colour = guide), data = hor, show.legend = TRUE, linetype = "dashed") +
  scale_linetype_manual(name="Horizontal lines", values = c("red","darkred")) +
  guides(
    linetype = guide_legend(override.aes = list(
      color = c("red","darkred"),
      orientation = c("horizontal", "horizontal")
    ))
  ) +
  new_scale("linetype") +
  geom_vline(aes(xintercept = xintercept, colour = guide), data = vert, show.legend = TRUE, linetype = "dashed") +
  scale_linetype_manual(name="Vertical lines", values = "green") +
  guides(
    linetype = guide_legend(override.aes = list(
      color = "green",
      orientation = "vertical"
    ))
  )
Expected
A desired result should have a guides with proper linetype orientation. Can be splitted in "horizontal" and "vertical" as ggnewscale does or combined.


