I used the answer to this question to try and add a vertical line to my time series plot: How do you plot a vertical line on a time series plot in Pandas?
This is my code:
ax = df.plot(figsize=(12,8), logy=True, title='Random Forest Regressor Performance',\
                 color={'price': 'blue', 'count': 'orange', 'pred': 'green'})

ax.axvline(pd.to_datetime('2021-08-23'), color='r', linestyle='--', lw=2)
And this is my data (I set the date (datetime) as an index):
| date | price | pred | count |
|---|---|---|---|
| 2018-01-01 | 13657.20 | 12671.454 | 89709 |
| 2018-01-02 | 14982.10 | 18561.360 | 125144 |
| 2018-01-03 | 15201.00 | 14437.636 | 134138 |
| ... | ... | ... | ... |
| 2021-10-30 | 61888.10 | 39418.360 | 283597 |
| 2021-10-31 | 61318.00 | 34461.636 | 312403 |
In my case, using this method results in the line being put way out of the actual data. The idea is to put the line to this graph. What I get:
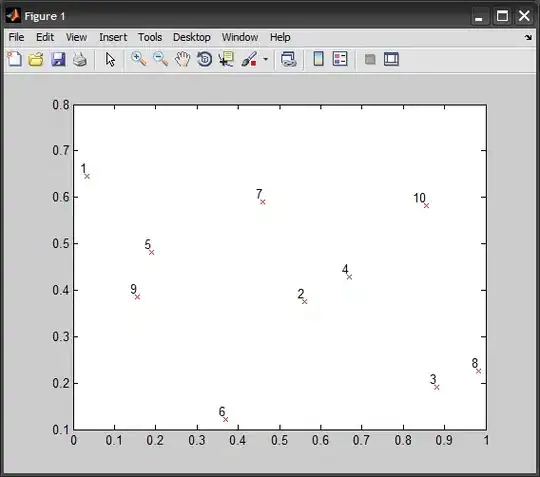
Expected Result:
