0

I am trying to create a caption for a choropleth map in R with RStudio. However, the font size for the caption is too small now. Here is my code:

png(filename = "kidspoverty map_final.png", units = "px", width = 1920, 
    height = 1080, res = 300)

tm_shape(spatial_data) + 
  tm_fill("kidspoverty", style = "pretty", palette = "-RdYlBu", 
          title = "% of children living in poverty") +
  tm_borders(lwd = 1, alpha = 1, col = "black") + 
  tm_layout(legend.outside = TRUE, legend.position = c("right", "bottom"), frame = F, inner.margins = c(0.07,0,0.01,0)) +
  tm_compass(position=c("RIGHT","top")) +
  tm_scale_bar(position=c("RIGHT","top")) +
  tm_credits(expression(paste(bold("Figure 2."), " A choropleth map showing the spatial distribution of child poverty percentages in Inner London.")), position = c("LEFT","BOTTOM"))

dev.off()

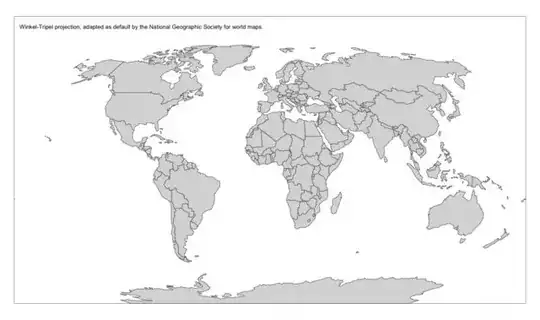
This is the output: enter image description here

I tried to increase the font size by adjusting size in tm_credits(), but it doesn't change the font size at all.

Therefore, I was wondering if there is a way to insert a line break, for example between "poverty" and "percentages", to enlarge the caption's font size. Thank you!

(I am new to RStudio, so if there is another way to increase the caption size, or a smarter method to include a partially bolded caption for tmap, I would be very grateful for your help.)

SK151076
  • 11
  • 1
  • 5

1 Answers1

0

If you save the graph to an object, like shp, you can change the size from default .7 like this: shp$tm_credits$credits.size = 1.

I think the easiest way to do this is might be when you export the graph, though. For example, using the example code that tmaps provides:

If I have the plot width at 1200 and height at 710 I get this:

enter image description here

If I keep the aspect ratio but set the width to 700:

enter image description here

Kat
  • 15,669
  • 3
  • 18
  • 51
  • I tried decreasing the width and height, it enlarged the compass, scale bar and legend but the size of the credit remained unchanged. May I ask how I can export the map if I save it to an object? Exporting directly from the plot panel doesn't work as it causes the compass and scale bar to become very large and overlap the map, but the legend title and credit becomes tiny. Thank you! – SK151076 Dec 13 '21 at 19:16
  • From `tmap`: if in plot mode, do this `tmap_save(shp, filename = "map.png")` and if you're in view mode, do this `tmap_save(shp, filename = "map.html")`. If you just want to view it, you only need to run the object name. – Kat Dec 13 '21 at 21:15
  • Thanks for your reply. I just saved the map with `shp$tm_credits$credits.size = 1` , however it didn't work either, the font size was not changed again. – SK151076 Dec 13 '21 at 22:14
  • Can you provide a [reproducible example](https://stackoverflow.com/questions/5963269/how-to-make-a-great-r-reproducible-example), so I can literally see what you're working with? – Kat Dec 14 '21 at 23:11