optional context feel free to skip: I'm currently using cartopy and matplotlib to read in and plot weather model data on a map. I have three different fields I'm plotting: temperature, wind, and surface pressure. I'm using contourf, barbs, and contour respectively to plot each field. I want one image for each field, and then I'd like one image that contains all three fields overlaid on a single map. Currently I'm doing this by plotting each field individually, saving each of the individual images, then replotting all three fields on a single ax and a new fig, and saving that fig. Since the data takes a while to plot, I would like to be able to plot each of the single fields, then combine the axes into one final image.
I'd like to be able to combine multiple matplotlib axes without replotting the data on the axes. I'm not sure if this is possible, but doing so would be a pretty major time and performance saver. An example of what I'm talking about:
from matplotlib import pyplot as plt
import numpy as np
x1 = np.linspace(0, 2*np.pi, 100)
x2 = x1 + 5
y = np.sin(x1)

firstFig = plt.figure()
firstAx = firstFig.gca()
firstAx.scatter(x1, y, 1, "red")
firstAx.set_xlim([0, 12])
secondFig = plt.figure()
secondAx = secondFig.gca()
secondAx.scatter(x2, y, 1, "blue")
secondAx.set_xlim([0, 12])

firstFig.savefig("1.png")
secondFig.savefig("2.png")
This generates two images, 1.png and 2.png.

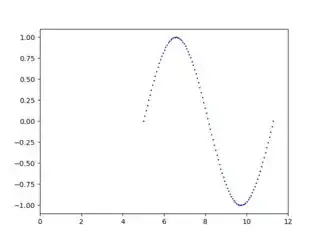
Is it possible to save a third file, 3.png that would look something like the following, but without calling scatter again, because for my dataset, the actual plotting takes a long time?