5

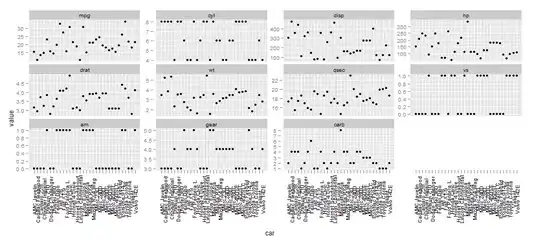
When trying to call grid.arrange to put multiple plots on a same ggplot2 graph, I first build a list of the plots I want. Then I build the corresponding argument list to call grid.arrange, as was explained in a previous question. This is my code (my dataframe is called manip):

args.list <- NULL;
plot.list <- NULL;
for (m in names(manip[2:10])) {
  plot.list <- c(plot.list, list(qplot(manip$side, y=manip[,m],ylab=m))
}
args.list <- c(plot.list, 1, 9)
names(args.list) <- c(names(manip)[2:10], list("nrow","ncol"))
do.call(grid.arrange, args.list)

This works, except that the 9 graphs are exactly the same! After checking, it turns out that the data is always the one corresponding to m=10. So my guess was that the value of m is not assigned in the loop, but evaluated later. However, the label ylab=m is assigned correctly and is different for all the graphs.

So I don't really get what the difference is and how the interpreter chooses when to evaluate m for the plots. Can someone explain?

Community
  • 1
  • 1
seb
  • 2,136
  • 3
  • 20
  • 27
  • Is there a reason why you build the plots separately rather than using facets? – Andrie Aug 12 '11 at 14:22
  • @Andrie: I guess that I could, but I would need to restructure my data frame – seb Aug 12 '11 at 14:33
  • That probably won't be difficult. In my answer I show both approaches. Reshaping your data.frame should only be two extra statements. One to load `reshape2` and the second to `melt` it. – Andrie Aug 12 '11 at 14:35

3 Answers3

4

The behavior is due to the lazy evaluation of R.

Here is a minimal(?) example:

d <- 1:3

args.list <- NULL;
plot.list <- NULL;
for (m in 1:3) {
 plot.list <- c(plot.list, list(qplot(d[m], d[m], ylab=letters[m])))
}

args.list <- c(plot.list, nrow=1, ncol=3)
do.call(grid.arrange, args.list)

in this case, d[m] is evaluated at the call of do.call. so m is 3 for all panel.

here is a workaround:

d <- 1:3

args.list <- NULL;
plot.list <- NULL;
for (m in 1:3) {
  plot.list <- c(plot.list,
    list(qplot(d, d, data=data.frame(d=d[m]), ylab=letters[m])))
}

args.list <- c(plot.list, nrow=1, ncol=3)
do.call(grid.arrange, args.list)

in this case, d[m] is evaluated at the call of qplot, and the d[m] is stored in the output object of qplot.

so, the simple solution is to pass data to qplot() or ggplot().

kohske
  • 65,572
  • 8
  • 165
  • 155
3

I will first answer your question and then show an alternative using a facet plot.

Edited

The following, much simplified, code seems to work:

library(gridExtra)
manip <- mtcars
plot.list <- lapply(2:11, 
                    function(x)qplot(manip$mpg, y=manip[, x], 
                    ylab=names(manip)[x]))
do.call(grid.arrange, c(plot.list, nrow=10))

It produces this ugly plot: enter image description here


Without knowing your objectives, it is dangerous to try and give advice, I know. Nonetheless, have you considered using facets for your plot instead?

The following code is much simpler, executes quiker and produces a graph that is easier to interpret:

library(reshape2)
manip <- mtcars
mmanip <- melt(manip, id.vars="mpg")
str(mmanip)
ggplot(mmanip, aes(x=mpg, y=value)) + 
    geom_point(stat="identity") + 
    facet_grid(.~variable, scales="free")

enter image description here

Andrie
  • 176,377
  • 47
  • 447
  • 496
  • Note that probably the first one does not work. All panels should have the same values. – kohske Aug 12 '11 at 14:43
  • @kohske: exactly, that's my point, it has the same problem as my solution; Andrie: I will try to use faceting, but would still be interested in knowing how to fix the problem that I brought up – seb Aug 12 '11 at 15:06
  • @kohske Well spotted. I think my edited answer works. The approach is quite different, so the OP needs to verify this is what he had in mind. – Andrie Aug 12 '11 at 15:13
  • @Andrie looks nice solution. And see my answer for the probably typical workaround. – kohske Aug 12 '11 at 15:17
2

Perhaps it would be better to melt then data and use faceting?

library(ggplot2)
manip <- data.frame(car = row.names(mtcars), mtcars)
manip.m  <- melt(manip)
qplot(car, value, data = manip.m) + facet_wrap(~variable, scales = "free_y")

It need some polishing in the xlab

last_plot() + opts(axis.text.x = theme_text(angle = 90))

enter image description here

HTH

Community
  • 1
  • 1
Luciano Selzer
  • 9,806
  • 3
  • 42
  • 40