0

My goal is to determine if points lie inside of a shape. Consider the following example:

import numpy as np
from matplotlib import pyplot as plt
import warnings
warnings.filterwarnings('ignore', 'invalid value encountered in sqrt')

r1 = 10
r2 = 4
a = 12  # x shift for circle 2
b = -4  # y shift for circle 2

theta = np.arange(0, 2*np.pi, 0.0006)

r1_complex = r1*np.exp(1j*theta)
r1_x, r1_y = np.real(r1_complex), np.imag(r1_complex)

r2_complex = r2*np.exp(1j*theta)
r2_x, r2_y = np.real(r2_complex) + a, np.imag(r2_complex) + b

fig, ax = plt.subplots()

ax.plot(r1_x, r1_y)
ax.plot(r2_x, r2_y)

ax.set_aspect('equal')
ax.grid()
plt.show()

output enter image description here

I want to find the points of the blue circle that are inside of the orange circle. It would be best to try and find it without iteration if possible.

For this case, I can easily determine the points that are inside of the orange circle because I know the equation of a circle. Amending the code to this:

import numpy as np
from matplotlib import pyplot as plt
import warnings
warnings.filterwarnings('ignore', 'invalid value encountered in sqrt')

r1 = 10
r2 = 4
a = 12  # x shift for circle 2
b = -4  # y shift for circle 2

theta = np.arange(0, 2*np.pi, 0.0006)

r1_complex = r1*np.exp(1j*theta)
r1_x, r1_y = np.real(r1_complex), np.imag(r1_complex)

r1_inside_y = np.logical_and(r1_y < np.sqrt(r2**2 - (r1_x - a)**2) + b, r1_y > -np.sqrt(r2**2 - (r1_x - a)**2) + b)

r2_complex = r2*np.exp(1j*theta)
r2_x, r2_y = np.real(r2_complex) + a, np.imag(r2_complex) + b

fig, ax = plt.subplots()

ax.plot(r1_x, r1_y)
ax.plot(r2_x, r2_y)
ax.plot(r1_x[r1_inside_y], r1_y[r1_inside_y])

ax.set_aspect('equal')
ax.grid()
plt.show()

output enter image description here

produces what I'm looking for. Is there a way to get this same result without knowing the equation for a circle? Perhaps an algorithm, or clever way with numpy operations?

edit

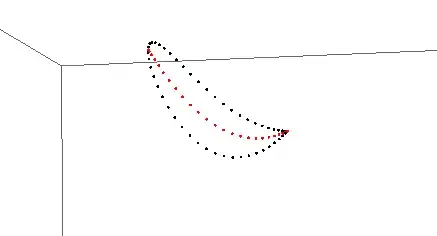
What I mean by arbitrary shape is an kind of closed shape with N number of points. Consider this image: enter image description here

I would like to know the points from the black line that lie inside the bounds of the red line. For this example, there are two points that this algorithm should find, the x4 and x5 points in blue. And the points x1, x2, ... xN would be coordinate points where both shapes share the same origin.

Gabe Morris
  • 804
  • 4
  • 21
  • You have drawn circles without knowing their equation and you want to find the intersecting points? My hunch is that your best bet is to estimate the circles' equation based on their shapes and then find the intersecting points. This would be computationally much cheaper, I guess. – user1984 Dec 22 '21 at 20:08
  • @user1984 The shapes are arbitrary. I just chose circles for this example. The shapes could be any sort of polygon. – Gabe Morris Dec 22 '21 at 20:21
  • 2
    How you define arbitrary shape? How do you make a check if point is inside arbitratry shape? – dankal444 Dec 22 '21 at 21:40
  • @dankal444 I edited the original post to answer your question and make things more clear. – Gabe Morris Dec 22 '21 at 21:52
  • How do you represent these shapes? – ruakh Dec 22 '21 at 22:10
  • 1
    @GabeMorris take a look [at this answer](https://stackoverflow.com/a/48760556/4601890) – dankal444 Dec 22 '21 at 22:11
  • @ruakh The shapes are represented by list of coordinate points. – Gabe Morris Dec 22 '21 at 22:16
  • @GabeMorris The inside of a convex polygon can very easily be defined by a set of linear inequations which look like the equations of the sides of the polygons, if the sides were prolonged into lines. The inside of a nonconvex polygon can also be defined algorithmically, but it's a lot more tedious, so if your polygon is known to be convex, you should take advantage of that. – Stef Dec 22 '21 at 22:33
  • Let's say that you wan't to know if point A is inside a given polygon. You need to take a point B that you know is outside the shape ( At infinite coordinates maybe... ). You need to count how many times the segment intersects with the shape. Even number of times, you are outside, odd number of times you are inside. – Akane Dec 22 '21 at 22:38
  • @Akane I think that algorithm is what I'm looking for. – Gabe Morris Dec 22 '21 at 22:40
  • @Stef The algorithm method is more desirable because the shape isn't always circular. – Gabe Morris Dec 22 '21 at 22:41
  • Yes I understand that. The shape is a polygon. But a convex polygon is still easier to deal with than a general polygon. – Stef Dec 22 '21 at 22:43
  • 1
    Or, if you are feeling lazy or don't fancy mathematical challenges... you can draw your `Y` polygon filled with white on a black background and see what colour your `X` points are. https://docs.opencv.org/4.x/d6/d6e/group__imgproc__draw.html#ga311160e71d37e3b795324d097cb3a7dc – Mark Setchell Dec 22 '21 at 22:46
  • @MarkSetchell Your idea does give me the thought to use matplotlib objects. But I need to gather the physical coordinates rather than just a visual. – Gabe Morris Dec 22 '21 at 22:51
  • @dankal444 I think that post may have the answer. I was skeptical at first because I didn't want to add an extra dependency, `shapely`, to my package for only a couple lines of code. But I think that answer shows how `matplotlib` holds the answer. – Gabe Morris Dec 22 '21 at 22:53
  • 1
    This should be fast... https://stackoverflow.com/a/58228861/2836621 – Mark Setchell Dec 23 '21 at 08:08
  • Are you looking for [Boolean operations on polygons](https://en.wikipedia.org/wiki/Boolean_operations_on_polygons)? Some GIS libraries have this, see e.g. [Finding if two polygons Intersect in Python?](https://gis.stackexchange.com/q/90055/198180) and [Get the coordinates of two polygon's intersection area (in Python)](https://stackoverflow.com/q/57885406/3744182). – dbc Dec 24 '21 at 19:37
  • @dbc I ended up resolving the issue using matplotlib. I'm not interesting in adding an extra dependency to my package for only one minor part of the overall objective of the package. – Gabe Morris Dec 25 '21 at 06:35

1 Answers1

0

It turns out, this algorithm has already been standardized in the matplotlib.path module. You can produce the same results using the Path class. Consider the following changes to the above code:

import numpy as np
from matplotlib import pyplot as plt
from matplotlib import path

r1 = 10
r2 = 4
a = 12  # x shift for circle 2
b = -4  # y shift for circle 2

theta = np.arange(0, 2*np.pi, 0.0006)

r1_complex = r1*np.exp(1j*theta)
r1_x, r1_y = np.real(r1_complex), np.imag(r1_complex)
stacked1 = np.stack((r1_x, r1_y), axis=1)  # A list of coordinates

r2_complex = r2*np.exp(1j*theta)
r2_x, r2_y = np.real(r2_complex) + a, np.imag(r2_complex) + b
stacked2 = np.stack((r2_x, r2_y), axis=1)  # A list of coordinates

p = path.Path(stacked2)
r1_inside = p.contains_points(stacked1)

fig, ax = plt.subplots()

ax.plot(r1_x, r1_y)
ax.plot(r2_x, r2_y)
ax.plot(r1_x[r1_inside], r1_y[r1_inside])

ax.set_aspect('equal')
ax.grid()
plt.show()

This produces the same image without knowledge of the mathematical properties of the shapes.

Gabe Morris
  • 804
  • 4
  • 21
  • The problem here is that the algorithm is really slow. I'm going to have to make some changes to how I do things because it's too slow. – Gabe Morris Dec 22 '21 at 23:16