1

I have a parallel (MPI) c/c++ program that from time to time leads to an error under certain conditions. Once the error occurs, a message is printed and the program exits; I'd like to set a break point to see the stack and more detail regarding what caused the error. I'm using TotalView to debug things, and I'd like it to stop at a break point in my error routine. I'd like it to always, automatically setup this break point. Is there a way to do this?

I'm looking into using signal.h and raise, but it's not clear yet how TotalView responds.

Looking at this question, How do you stop in TotalView after an MPI Error?, it appears that C++ exception handling, i.e. throw(), will automatically cause TotalView to stop. What's the right way to do this in C?
Community
  • 1
  • 1
Yann
  • 33,811
  • 9
  • 79
  • 70

2 Answers2

4

I have no idea what totalview is, so this may not be applicable.

In windows: DebugBreak();
In x86 assembly: __asm int 3;
In linux: raise(SIGTRAP);

For the windows one, I have a handy macro I use:
#define DEBUGME() do{if (IsDebuggerPresent()) DebugBreak();}while(0)
Which causes execution to continue if there's no debugger attached.

Mooing Duck
  • 64,318
  • 19
  • 100
  • 158
  • This is a good idea, and probably would work, but I'm running this code on *nix systems. TotalView is a debugger. – Yann Aug 12 '11 at 20:57
  • Might as well give the x86 assembly a try then. That's all I could find for linux. – Mooing Duck Aug 12 '11 at 21:29
  • The assembly almost works, and I suspect TotalView reserves this "int 3" assembly statement for its own internal use. When I include `__asm__("int3")` at my desired break point, compile and run the code, I don't get the desired effect. The processes are still labeled as running, even though it's obvious the code has stopped at the break point. The status bar lists the program being at __dl__debug__state, but the source code is not shown. If I 'halt' the program, then I get the desired effect, and I see the source code at my break point. – Yann Aug 15 '11 at 15:07
  • After looking at this SO question (http://stackoverflow.com/questions/1721543/continue-to-debug-after-failed-assertion-on-linux-c-c/1721575#1721575), I found that my syntax for the assembly is slightly off. It should be `__asm__("int $3");`. Unfortunately after correcting this, I get the same behavior I discuss above. – Yann Aug 15 '11 at 15:21
  • Did you try the raise(SIGTRAP)? If that doesn't work then I have no ideas. – Mooing Duck Aug 15 '11 at 15:59
  • Yes, I would expect raise(SIGTRAP) to have the same effect as your suggestion, but it appears that raise(SIGTRAP) is reserved and apparently ignored by TotalView. – Yann Aug 15 '11 at 16:06
4

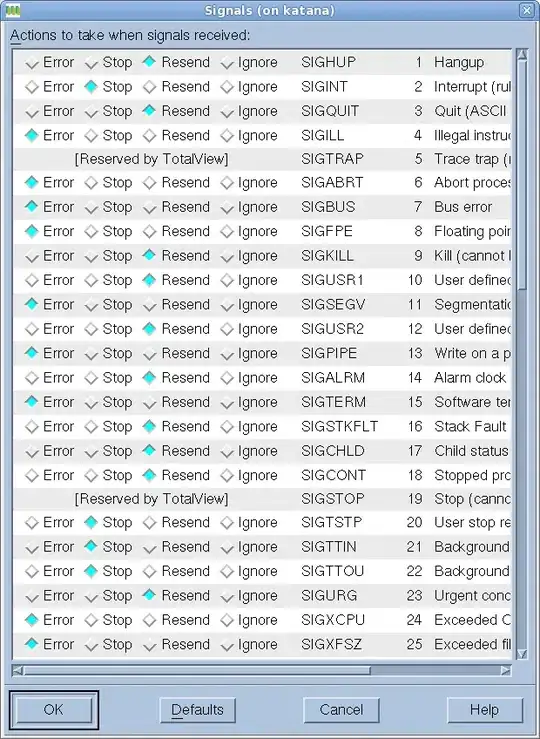
In TotalView, the File > Signals menu option opens this window:

TotalView Signals Window

This is to control the default behavior in response to signal calls. SIGTRAP and SIGSTOP are reserved, and it seems TotalView treats these differently. That is raise(SIGSTOP) did not stop as expected in TotalView.

This program:

#include <signal.h>

main(int argc, char* argv[])
{
  raise(SIGTRAP);
}

produces this response:

Unexpected trap not caused by breakpoint!

And the program state is listed as "Exited or Never Created". When SIGTRAP is replaced with SIGSTOP, the same result occurs, but without the "Unexpected..." message.

As is shown in the image above, SIGINT, SIGTSTP, SIGTTIN and SIGTTOU by default lead TotalView to stop, as if there were a break point.

In a similar fashion to the answer provided by Mooing Duck (Totalview: is there a way to hardcode a break point?), these raise() calls can be optionally made if you are trying to debug:

#ifdef DEBUG
raise(SIGTSTP)
#endif

This is just one of many ways to probably get the desired effect of a hard coded break point.

Yann
  • 33,811
  • 9
  • 79
  • 70