I have a matplotlib gridspec plot as below:
import matplotlib.pyplot as plt
import matplotlib.gridspec as gridspec

fig2 = plt.figure(figsize=[8,8])
spec2 = gridspec.GridSpec(ncols=2, nrows=2, figure=fig2)
f2_ax1 = fig2.add_subplot(spec2[0, 0])
f2_ax2 = fig2.add_subplot(spec2[0, 1])
f2_ax3 = fig2.add_subplot(spec2[1, 0])
f2_ax4 = fig2.add_subplot(spec2[1, 1])
I want to add gridlines for the above plot. I'm not able to do that with hlines as gridpec attribute has no object hlines.
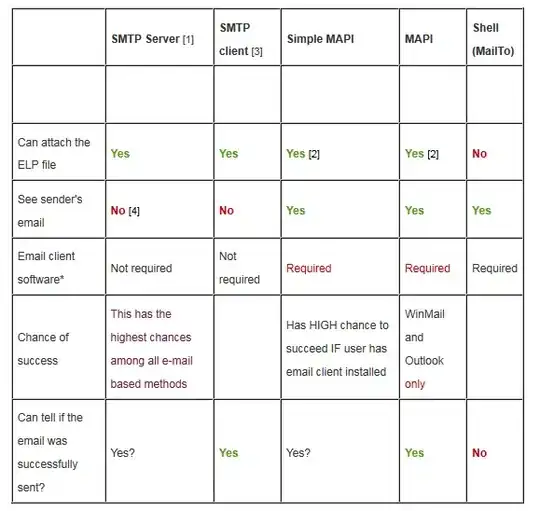
Is it possible to add gridlines for gridspec object in matplotlib as below:


