I need some help with my need to create a dataframe that is generated inside a function that makes use of a for loop for each row of a given dataframe in R.
In summary, my role seeks to facilitate a data quality process that I'm doing as an initial step in a future training on a predictive pricing model. In this sense, we have in our database some important economic variables that do not have a temporal frequency smaller than the month (eg meat production in Brazil). Furthermore, you may notice that in some cases, the values for a few months tend to be repeated for some variables, which on another occasion will require an adequate treatment for our algorithms and models to understand with greater statistical precision.
As our target has a daily temporality (prices), I thought of creating a function (called month_to_daily() ) that would be able to "transform"
these monthly data into daily ones with a certain level of variability around its "average" values (real values) with the rnorm function
assuming a standard deviation = 1. (I also accept suggestions for improvement on this)
I could simply "monthly" my dataset at this stage of the work to capture the last values of each month to make our inferential studies, as well as feature selection and causality orders, but I was forced to opt for this more difficult path to transform data monthly in daily with randomization as we need price forecasts on each new day or as each new price is registered in our data pipeline and consumed and re-estimated by our model quickly.
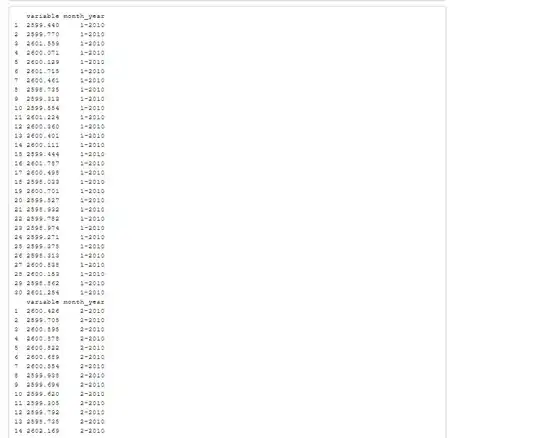
So, after you use my function ( month_to_daily(monthly_dataset$variable, monthly_dataset$timestamp) ) the results are
printed to the output of R the way I would like it to be generated, but expected as a dataframe for manipulation inside of R itself,
enabling the generation of graphics, export to an object of the type of time series, and so on. And it is exactly at this stage that I am having difficulty
with how to do this.
Next, I'll describe the code blocks where I demonstrate my step-by-step awaiting your contribution to suggestions on how
to generate or populate a data.frame inside my function created with the for loop inside it.
Initially I load the R packages I intend to use:
library(dplyr)
library(tidyverse)
library(fpp3)
library(lubridate)
library(xts)
library(zoo)
library(ggplot2)
library(plotly)
Then I load my example data:
monthly_dataset <- read.csv("https://github.com/rhozon/datasets/raw/master/dataset_monthly_faked_data.csv", head =TRUE, sep = "," ) %>%
  mutate(timestamp = yearmonth(Index),
         Index = as.Date(Index))

glimpse(monthly_dataset)
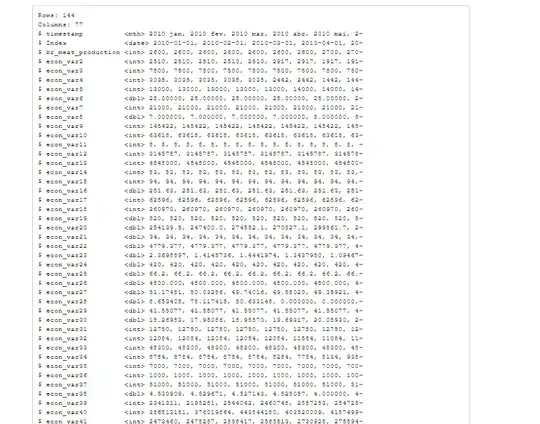
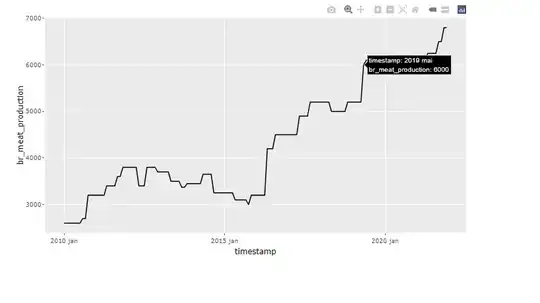
We can preview the selected time series for our purposes:
ggplotly(
ggplot(monthly_dataset, aes(
                            x = timestamp,
                            y = br_meat_production
                            )) +
  geom_line()
)
And then with the creation of my function (month_to_daily) that transforms monthly data into daily data with variability, I have:
month_to_daily <- function( var, ref_month ){

  set.seed(123)

  for (i in 1:length(var)){

   daily_values <-

    rnorm(
      n = days_in_month(ref_month[i])-1, # days avaiable in each month

      mean = var[i], # values tend to be around oscilate the real values of each month

      sd = 1 # Rnd number generator with ~N(0,1)
     ) %>% # How can I put an if condition for integer or double for decimal rounding inside rnorm function ? cause selected variable is integer then, round to zero decimal values else use only two digits.

   as.data.frame() %>% # How to populate it ?

   mutate(
     month_year = paste(month(ref_month[i]), "-" , year(ref_month[i]) ),
     month_year = gsub(" ", "", month_year )
     ) %>%

  rename(variable = ".") # How to put here the name of the user selected variable ?


 print(daily_values)

 # Here is my difficult: How to generate an dataframe object inside the function results ?

  }

}
Using the function on the data from the loaded example dataset, we have
br_meat_production_daily <- month_to_daily(monthly_dataset$br_meat_production, monthly_dataset$timestamp)

class(br_meat_production_daily) # Object created is NULL !
How can I set br_meat_production_daily for example, as dataframe object including the first column as day (labeled), the second one using the month_year and the third the
simulated values ? Maybe after I can call ggplot2 to plot the graph of the new generated time series by using the variable name (in this object) versus the day/month/year of the
new created trajectory.
For an better explanation, the desired output for me is something like that:
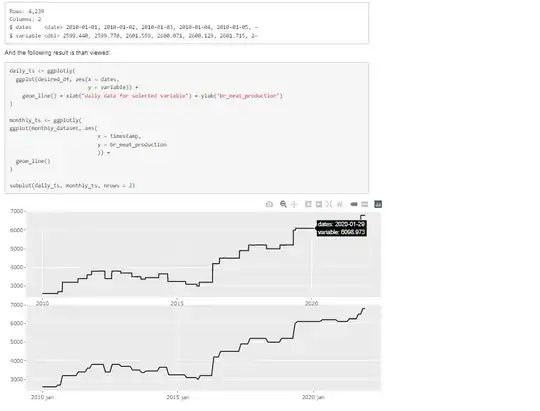
Notice that what I called desired_df contains the values generated by the output of the function I created earlier for br_meat_production.
The upper graph has the daily data generated by the function and the lower one the original monthly values.
So, given that I've explained my step-by-step here, what would be the best recommendation to generate this desired dataframe from this function that transforms monthly data into daily with some randomization technique around its actual values for each month during all the days of that that month?