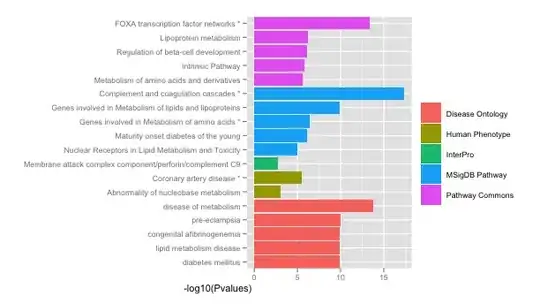
I am creating this "barplot" with ggplot, but I would like to be able to reorrder the bars within each categories so the highest bars are on top. In short having a High to Low bars ordering withing each categories.
Below is my code - Any hints are welcome - Thanks
library("ggplot2")
d <- read.csv('http://db.tt/EOtR3uh', header = F)

d$V4 <- factor(d$V2, levels=d$V2)
base_size <- 11
ggplot(d, aes(d$V4, -log10(d$V3), fill=d$V1)) +
geom_bar(stat="identity") +
coord_flip() +
labs(y = "-log10(Pvalues)",x = "",fill="") +
theme_grey(base_size = base_size) +
scale_x_discrete(expand = c(0, 0))