I have boolean data on a 2D grid and want to use matplotlib to plot a countour between the areas where the data is True and False.
However, the separation between these areas is not smooth within the actual data. How can I compute a smoothed countour given this data?
Here is a minimal example:
import numpy as np
import matplotlib.pyplot as plt

# generate some non-smooth example data
MESHSIZE = 10
REFINEMENT = 4*MESHSIZE
x = np.linspace(-MESHSIZE, MESHSIZE, REFINEMENT)
xv, yv = np.meshgrid(x, x)
xvf = xv.reshape(-1)
yvf = yv.reshape(-1)


def choppy_circle(x, y):
    inner = x.astype(int)**2+y.astype(int)**2 < 10.0
    return inner


# consider this the *actual* data given to me as-is
my_x = xvf
my_y = yvf
my_z = choppy_circle(xvf, yvf)

# need to visualize the contour that separates areas where
# my_z is True/False
plt.tricontour(my_x, my_y, my_z, levels=np.array([1.0-1e-3]))
plt.scatter(xv, yv, s=0.1)
plt.show()
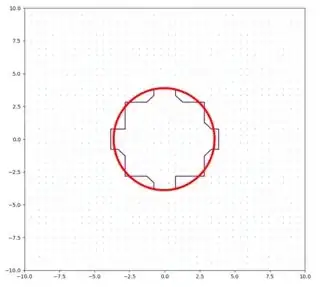
This produces the following plot, which is faithful to the data, but not what I'm looking for:
How can I use the data given in my_x, my_y and my_z to construct a smoothed contour around the domain where my_z is True?
Something like this:


