Dear experienced friends, I am curious about how to draw a scatter plot where the points with the same X-values have the same color? Suppose we have a dataset like the following:
import matplotlib.pyplot as plt

list1 = [1,1,1,1,2,2,2,2,3,3,3,3]
list2 = [9,8,10,11,1,2,1,2,4,5,6,7]

plt.scatter(list1, list2)
plt.show()
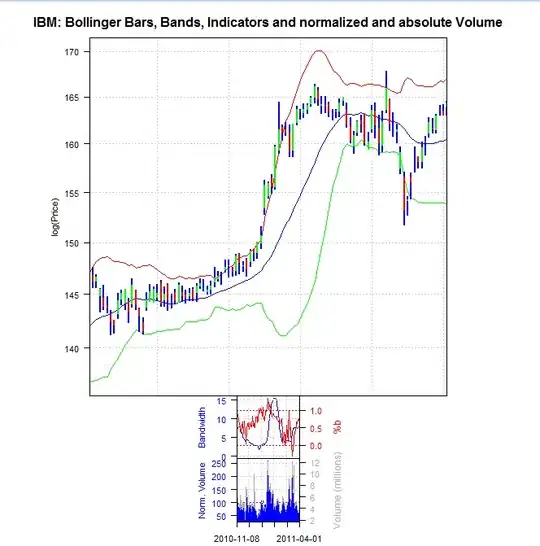
However, I want to draw a picture like the following one. As you can see, the points with the same x-axis value have the same color. How can I achieve this? Thank you so much in advance!


