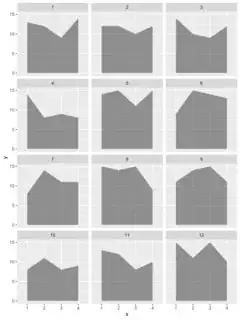
I am generating facetted plots (ggplot / ggsave) as SVG files for use in a WORD (Office 365, Windows 10) document that will be converted to a PDF.
As a workaround for a limitation in WORD I wish to increase the SVG dimensions by a factor of 10 (for example, a width of 16.5 cm becomes 165 cm as explained later). When I save at normal dimensions (i.e., 16.5 cm) no issues, but with the larger dimension (i.e., 165 cm) the SVG file loses details and elements of the plot.
Here is a working example:
library(ggplot2)

d <- data.frame(
  group = rep(1:12, each = 4),
  x = factor(1:4),
  y = sample(8:15, size = 48, replace = TRUE)
)


ggplot(d, aes(x = x, y = y, group = 1))+
  geom_area(size = 0.5/.pt, alpha = 0.5) +
  facet_wrap(~group, ncol = 3)

ggsave("SO_example-normaldim.svg", width = 16.5, height = 22, units = "cm", device = "svg")
This yields (converted to a bitmap so I could upload it):
No issues with R or ggplot2 at this point. Imported into WORD, and everything looks great.
However, when the WORD doc is exported as (or saved as, or printed to) a PDF, the thickness (size) of the line (top border of the area) increases.
This is caused by WORD, which sets the minimum line thickness to 1 pixel at 96 dpi based on the original image size. The proposed solution is to set the SVG dimensions to be significantly greater (i.e., factor by 10 or 100) then resize the image after inserting it in WORD. [1]
You can change the dimensions manually in the <SVG> tag in the SVG file using a text editor. I've tested this and the solution works. The line thickness in PDF versions appears correctly and, because the SVG file is a vector graphic, factoring the dimensions by ten or even 100 does not affect the file size (apart from the added text to set the dimensions, which is trivial).
This is a relatively easy fix; however, it is preferable to omit the manual revision step and simply save the SVG at the larger dimensions from R.
The following should save a version of the SVG plot with 10 times greater dimensions (note the addition of limitsize = FALSE is necessary because the image is now greater than 50 inches in either dimension).
ggsave("SO_example-largedim.svg", width = 16.5*10, height = 22*10, # 10 x wider, 10 x taller
       units = "cm", device = "svg", limitsize = FALSE)
# Note: increasing the dpi by 10x, instead of the dimensions, does nothing in this example
#       the saved SVG is the same dimensions as the original attempt above
This does not save as expected. The resulting image (again converted to bitmap and scaled for upload) looks like this:
Facet strips, axes labels/text, gridlines and alpha settings are missing.
What is causing this? Is there a better way to scale the image dimensions while preserving the appearance of the plot?

