6

Creating a call stack diagram

We have just recently been thrown into a big project that requires us to get into the code (duh).

We are using different methods to get acquainted with it, breakpoints etc. However we found that one method is to make a call tree of the application, what is the easiest /fastest way to do this?

By code? Plugins? Manually?

The project is a C# Windows application.
Mikelangelo
  • 907
  • 8
  • 20
  • If you're searching, try the more common name "call graph." If your call graph turns out to be a tree, then you don't have a very interesting program because every function has exactly one caller. Either way, what you're looking for is never called a "call stack." – Rob Kennedy Apr 02 '09 at 13:16
  • Related: http://stackoverflow.com/q/793685/945456 – Jeff B Jan 13 '16 at 20:13

6 Answers6

4

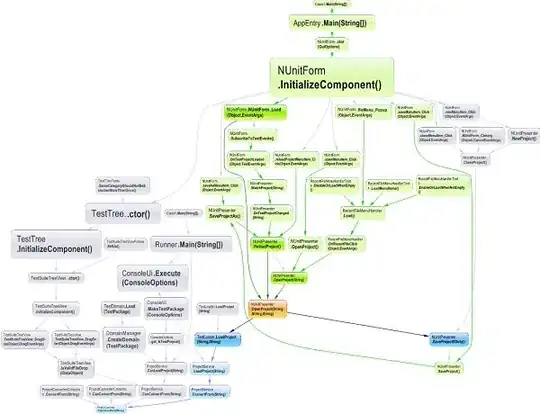
With the static analyzer NDepend, you can obtain a static method call graph, like the one below. Disclaimer: I am one of the developers of the tool

Call graph

For that you just need to export to the graph the result of a CQLinq code query:

code query exporting

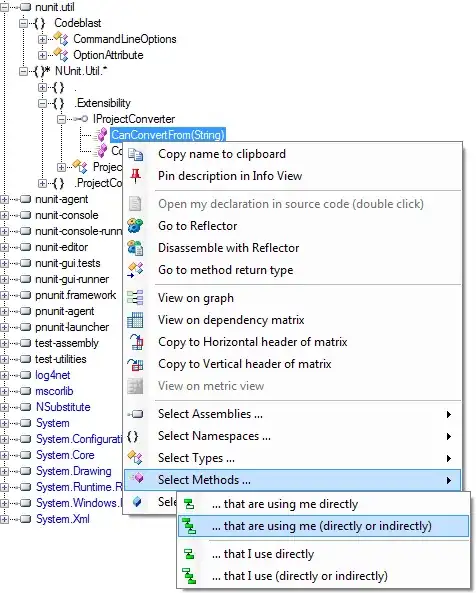
Such a code query, can be generated actually for any method, thanks to the right-click menu illustrated below.

Select methods that use me directly or indirectly

Patrick from NDepend team
  • 13,237
  • 6
  • 61
  • 92
2

Whenever I start a new job (which is frequently as I am a contractor) I spend two to three days reading through every single source file in the repository, and keep notes against each class in a simple text file. It is quite laborious but it means that you get a really good idea how the project fits together and you have a trusty map when you need to find the class that does somethnig.

Altought I love UML/diagramming when starting a project I, personally, do not find them at all useful when examining existing code.

Paul Ruane
  • 37,459
  • 12
  • 63
  • 82
1

Not a direct answer to your question, but NDepend is a good tool to get a 100ft view of a codebase, and it enables you to drill down into the relationships between classes (and many other features)

Mitch Wheat
  • 295,962
  • 43
  • 465
  • 541
0

Edit: I believe the Microsoft's CLR Profiler is capable of displaying a call tree for a running application. If that is not sufficient I have left the link I posted below in case you would like to start on a custom solution.


Here is a CodeProject article that might point you in the right direction:

The download offered here is a Visual Studio 2008 C# project for a simple utility to list user function call trees in C# code.

This call tree lister seems to work OK for my style of coding, but will likely be unreliable for some other styles of coding. It is offered here with two thoughts: first, some programmers may find it useful as is; second, I would be appreciative if someone who is up-to-speed on C# parsing would upgrade it by incorporating an accurate C# parser and turn out an improved utility that is reliable regardless of coding style

The source code is available for download - perhaps you can use this as a starting point for a custom solution.

Andrew Hare
  • 344,730
  • 71
  • 640
  • 635
0

You mean something like this: http://erik.doernenburg.com/2008/09/call-graph-visualisation-with-aspectj-and-dot/

Igor Brejc
  • 18,714
  • 13
  • 76
  • 95
0

Not to be a stuck record, but if I get it running and pause it a few times, and each time capture the call stack, that gives me a real good picture of the call structure that accounts for the most time. It doesn't give me the call structure for things that happen real fast, however.

Mike Dunlavey
  • 40,059
  • 14
  • 91
  • 135