0

I'm analyzing a dataset for my master thesis. The data come from a survey I created. I'm trying to google anything I can but being the dataset not sparse enough I'm having some lengths problems (for example, some item have values ranging from 1-7, some others only from 2-6. the scale used is a 7 point likert scale but if, for example, an item didn't get 7 at least once, it will be of a different length compared to a more sparse one)(Problem 1).

structure(list(AD_BORING_1 = c("3", "2", "4", "1", "6", "3", 
"7", "6", "2", "3", "5", "4", "6", "5", "5", "6", "5", "2", "2", 
"6", "2", "3", "5", "4", "5", "5", "1", "2", "4", "2", "3", "6", 
"5", "5", "3"), AD_IRRITATING_1 = c("3", "2", "2", "1", "7", 
"5", "6", "4", "5", "5", "1", "5", "4", "3", "5", "6", "5", "2", 
"2", "4", "5", "3", "2", "4", "3", "4", "1", "2", "4", "5", "4", 
"4", "7", "4", "2"), AD_DISTURBING_1 = c("3", "1", "3", "3", 
"4", "1", "3", "2", "2", "4", "1", "3", "4", "2", "1", "4", "2", 
"2", "2", "4", "1", "5", "1", "2", "2", "2", "1", "2", "4", "2", 
"4", "2", "4", "6", "2"), AD_CREDIBLE_1 = c("5", "5", "3", "2", 
"1", "2", "6", "3", "6", "3", "5", "4", "2", "3", "4", "1", "5", 
"3", "3", "2", "1", "3", "5", "3", "2", "4", "6", "6", "3", "1", 
"5", "6", "2", "3", "5"), AD_GOOD_1 = c("5", "5", "3", "2", "2", 
"5", "3", "4", "5", "2", "5", "2", "1", "5", "4", "2", "2", "5", 
"5", "2", "3", "5", "4", "4", "4", "4", "6", "4", "3", "2", "4", 
"4", "1", "4", "5"), AD_HONEST_1 = c("5", "3", "3", "2", "2", 
"1", "4", "3", "5", "2", "6", "1", "2", "2", "3", "2", "4", "3", 
"2", "2", "2", "3", "2", "4", "1", "3", "4", "3", "2", "2", "3", 
"5", "1", "4", "3"), AD_TRUTHFUL_1 = c("5", "3", "4", "2", "2", 
"1", "5", "3", "5", "2", "5", "2", "2", "3", "3", "2", "5", "3", 
"2", "1", "2", "2", "4", "5", "1", "3", "4", "4", "4", "1", "2", 
"3", "1", "1", "3"), AD_LIKEABLE_1 = c("5", "4", "3", "2", "2", 
"6", "2", "4", "5", "4", "4", "3", "3", "4", "3", "4", "5", "6", 
"7", "1", "2", "2", "2", "4", "1", "3", "6", "6", "2", "4", "1", 
"4", "1", "3", "5"), AD_ENJOYABLE_1 = c("5", "5", "3", "2", "2", 
"4", "2", "4", "5", "4", "5", "3", "2", "6", "3", "2", "5", "6", 
"7", "2", "2", "2", "4", "5", "2", "3", "7", "6", "3", "4", "4", 
"3", "1", "3", "4"), LIKE_1 = c("6", "5", "3", "2", "1", "4", 
"2", "3", "5", "3", "4", "3", "1", "4", "3", "3", "5", "5", "7", 
"1", "4", "5", "4", "4", "2", "4", "6", "6", "4", "3", "4", "4", 
"1", "2", "5")), row.names = c(NA, -35L), class = c("tbl_df", 
"tbl", "data.frame"))

The rows of the main dataset are just the n. of observations and every item score is in the columns.

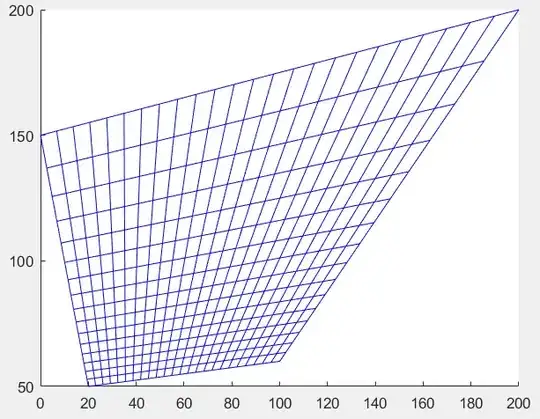
Another problem is I have no idea how to properly plot them all together to be compared in a simple barplot like for example the picture below:

Example

I tried with items of the same length using this code:

prova <- data.frame(table(A_DF_GIL$AD_BORING_1), table(A_DF_GIL$AD_IRRITATING_1))
barplot(as.matrix(prova))

but still the result is not the one I need. Can anybody help me please? Thank youu
  • It's hard to give you specific help until you share your actual data using `dput()` or similar. See [here](https://stackoverflow.com/questions/5963269/how-to-make-a-great-r-reproducible-example) for details on how to share a reproducible example of your issue. – Dan Adams Feb 08 '22 at 17:37
  • That said, you will probably want to have `0` in the positions where there's no data, treat the 'labels' as a `factor`, and then follow a typical `tidyr::pivot_longer()` followed by `ggplot2::ggplot()+geom_col()` as demonstrated (e.g.) in [this](https://stackoverflow.com/questions/71037779/plotting-column-graph-with-multiple-groups-using-ggplot) recent question. – Dan Adams Feb 08 '22 at 17:43
  • Thank you! Here's the dput() structure(list(AD_BORING_1 = c(2, 4, 3, 5, 3, 2, 5, 3, 3, 3, 2, 2, 6, 2, 2, 4, 2), AD_IRRITATING_1 = c(2, 2, 3, 3, 1, 2, 6, 3, 4, 2, 2, 2, 4, 3, 5, 4, 2), AD_DISTURBING_1 = c(4, 2, 2, 1, 1, 2, 5, 3, 2, 1, 2, 2, 5, 4, 6, 4, 5)), row.names = c(NA, -17L ), class = c("tbl_df", "tbl", "data.frame")) – Andrea Giuseppe Parialò Feb 08 '22 at 17:51
  • Great - can you add that to your question using the `edit` link at the bottom? and format as code using the bactick marks ` – Dan Adams Feb 08 '22 at 17:53
  • Yes I just did. Thank you so much I'm new to this. – Andrea Giuseppe Parialò Feb 08 '22 at 17:56

1 Answers1

1

Here's an updated response with your more full dataset now that I understand your goal better.

In processing the data I used a renaming function with a regex to clean up the names but this is optional. I also converted the scores to a factor so it's easy to treat them as ordinal discrete data (which they are) rather than continuous. However I convert back to continuous data in the bottom example to calculate a mean() which is one option for decrowding the plot.

Given the large volume, I opted for a stacked bar plot using geom_bar(position = "stack"), but try "dodge" to see for yourself.

Also I commented out the line to facet by LIKE but you should try it out to see if that is more informative.

I also applied some aesthetics that I subjectively like but mostly to demonstrate that there's a lot of control in {ggplot2} that you can customize.

I applied likert scale labels to the color scale which you can customize if that's helpful or just omit by dropping the labels = likert_scale.

library(tidyverse)

d <- structure(list(AD_BORING_1 = c("3", "2", "4", "1", "6", "3", "7", "6", "2", "3", "5", "4", "6", "5", "5", "6", "5", "2", "2", "6", "2", "3", "5", "4", "5", "5", "1", "2", "4", "2", "3", "6", "5", "5", "3"), AD_IRRITATING_1 = c("3", "2", "2", "1", "7", "5", "6", "4", "5", "5", "1", "5", "4", "3", "5", "6", "5", "2", "2", "4", "5", "3", "2", "4", "3", "4", "1", "2", "4", "5", "4", "4", "7", "4", "2"), AD_DISTURBING_1 = c("3", "1", "3", "3", "4", "1", "3", "2", "2", "4", "1", "3", "4", "2", "1", "4", "2", "2", "2", "4", "1", "5", "1", "2", "2", "2", "1", "2", "4", "2", "4", "2", "4", "6", "2"), AD_CREDIBLE_1 = c("5", "5", "3", "2", "1", "2", "6", "3", "6", "3", "5", "4", "2", "3", "4", "1", "5", "3", "3", "2", "1", "3", "5", "3", "2", "4", "6", "6", "3", "1", "5", "6", "2", "3", "5"), AD_GOOD_1 = c("5", "5", "3", "2", "2", "5", "3", "4", "5", "2", "5", "2", "1", "5", "4", "2", "2", "5", "5", "2", "3", "5", "4", "4", "4", "4", "6", "4", "3", "2", "4", "4", "1", "4", "5"), AD_HONEST_1 = c("5", "3", "3", "2", "2", "1", "4", "3", "5", "2", "6", "1", "2", "2", "3", "2", "4", "3", "2", "2", "2", "3", "2", "4", "1", "3", "4", "3", "2", "2", "3", "5", "1", "4", "3"), AD_TRUTHFUL_1 = c("5", "3", "4", "2", "2", "1", "5", "3", "5", "2", "5", "2", "2", "3", "3", "2", "5", "3", "2", "1", "2", "2", "4", "5", "1", "3", "4", "4", "4", "1", "2", "3", "1", "1", "3"), AD_LIKEABLE_1 = c("5", "4", "3", "2", "2", "6", "2", "4", "5", "4", "4", "3", "3", "4", "3", "4", "5", "6", "7", "1", "2", "2", "2", "4", "1", "3", "6", "6", "2", "4", "1", "4", "1", "3", "5"), AD_ENJOYABLE_1 = c("5", "5", "3", "2", "2", "4", "2", "4", "5", "4", "5", "3", "2", "6", "3", "2", "5", "6", "7", "2", "2", "2", "4", "5", "2", "3", "7", "6", "3", "4", "4", "3", "1", "3", "4"), LIKE_1 = c("6", "5", "3", "2", "1", "4", "2", "3", "5", "3", "4", "3", "1", "4", "3", "3", "5", "5", "7", "1", "4", "5", "4", "4", "2", "4", "6", "6", "4", "3", "4", "4", "1", "2", "5")), row.names = c(NA, -35L), class = c("tbl_df", "tbl", "data.frame"))

# make labels in case that helps
likert_breaks <- c("Strongly Disagree", "Somewhat Disagree", "Slightly Disagree", "Neutral", "Slightly Agree", "Somewhat Agree", "Strongly Agree")

# process and plot as stacked bar plot with optional faceting
d %>%
  rename_with(~str_extract(.x, "(?<=_)(.*)(?=_)"), contains("AD")) %>%
  rename(LIKE = LIKE_1) %>%
  mutate(across(everything(), as.integer)) %>%
  mutate(respondent = row_number()) %>%
  pivot_longer(-c(respondent, LIKE), names_to = "adjective", values_to = "likert") %>%
  mutate(likert = factor(likert)) %>%
  ggplot(aes(adjective, fill = likert)) +
  geom_bar(stat = "count", position = "stack") +
  # facet_wrap(~LIKE) +
  scale_fill_viridis_d(option = "A", begin = 0, end = 0.85, labels = likert_breaks) +
  theme_bw() +
  theme(axis.text.x = element_text(angle = 90))

Another option to keep things more compact is just to show the mean score for each adjective. In this case you need to leave it as a numeric so you can apply a summarizing function like mean().

# just show mean likert scores for each
d %>%
  rename_with(~str_extract(.x, "(?<=_)(.*)(?=_)"), contains("AD")) %>%
  rename(LIKE = LIKE_1) %>%
  mutate(across(everything(), as.integer)) %>%
  mutate(respondent = row_number()) %>%
  pivot_longer(-c(respondent, LIKE), names_to = "adjective", values_to = "likert") %>%
  group_by(adjective) %>%
  summarise(likert = mean(likert)) %>%
  ggplot(aes(reorder(adjective, -likert), likert)) +
  geom_col() +
  theme_bw() +
  theme(axis.text.x = element_text(angle = 90))

Created on 2022-02-08 by the reprex package (v2.0.1)

Dan Adams
  • 4,971
  • 9
  • 28
  • Thank you! I'm trying to digest the code and understand what everything does. Hopefully, I will manage to do it. I'll come back to this post to keep you posted – Andrea Giuseppe Parialò Feb 08 '22 at 19:47
  • Sure, happy to help. It would be good if you could add more detail to what you want the plot to look like. For example where it says "Barplot1, Barplot2..." what should that say in the plot you're trying to make with this data? Also are the different colors of bar (Label1, Label2...) supposed to be the different reactions as in my example or something else? – Dan Adams Feb 08 '22 at 19:52
  • Also it might help to just add one line of the code at a time and inspect the output to learn what's happening at each step. – Dan Adams Feb 08 '22 at 19:54
  • Thanks man! Appreciate it. Ok, so I tried to apply your code to my dataset. I deleted the slice_head and just adapted to my use (I have much more columns). The code I adapted in the next comment – Andrea Giuseppe Parialò Feb 08 '22 at 20:13
  • ```A_DF_LOR_prova %>% + mutate(ad_number = row_number()) %>% + pivot_longer(-ad_number, names_to = c("AD", "reaction", "num"), names_sep = "_", values_to = "count") %>% + select(-AD) %>% + mutate(reaction = factor(reaction, levels = c("BORING", "IRRITATING", "DISTURBING", "CREDIBLE", "GOOD", "HONEST", "TRUTHFUL", "LIKEABLE", "ENJOYABLE", "LIKE"))) %>% + ggplot(aes(ad_number, count, fill = reaction))+ + geom_col(position = "dodge")``` – Andrea Giuseppe Parialò Feb 08 '22 at 20:13
  • I get: ```Error in `context_peek()`: ! `n()` must only be used inside dplyr verbs. Run `rlang::last_error()` to see where the error occurred.``` – Andrea Giuseppe Parialò Feb 08 '22 at 20:14
  • I'll try to explain a bit more in deep my research. I'm trying to analyze the change in attitude towards a Deepfake ad depending on the position of the disclosure "This video was realized using deepfake technology". My survey had different randomized scenarios for each respondents. In this case, A_DF_LOR = Deepfake (DF) video with disclosure displayed after (A) the ad by L'Oreal (LOR). The disclosure could be before (B), during (D), or after (A). For every different scenario I ask the same questions. The goal is to compare the different attitudes for each scenario – Andrea Giuseppe Parialò Feb 08 '22 at 20:18
  • do you have {plyr} loaded? It might be colliding with {dplyr}. If you don't need it it will make life easier to avoid loading {plyr} if you plan to also use the newer {dplyr}. You can also explicitly specify the package with `dplyr::mutate()` and then I think it will work. – Dan Adams Feb 08 '22 at 20:19
  • Boring, Irritating, Disturbing are just some items of a matrix question "This ad was..." on a 7point likert scale where 1=Strongly Disagree and 7=Strongly Agree – Andrea Giuseppe Parialò Feb 08 '22 at 20:20
  • Let us [continue this discussion in chat](https://chat.stackoverflow.com/rooms/241838/discussion-between-andrea-giuseppe-parialo-and-dan-adams). – Andrea Giuseppe Parialò Feb 08 '22 at 20:25