2

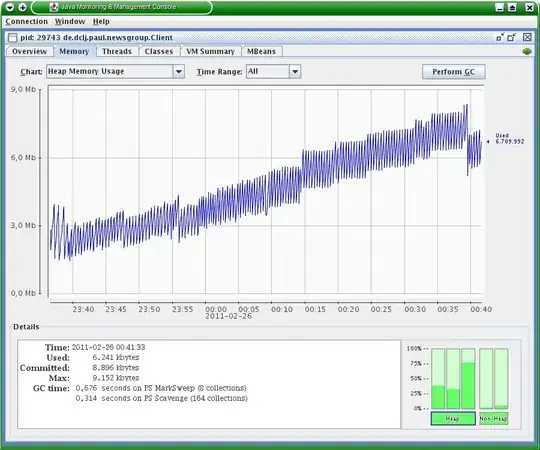
i'm working on several jobs on Databricks, this is one of those, it reads data...and now I dont get what it's doing, no network, no cpu. The process reads data from a S3 mounted on DBFS, process it and store it on anoter S3 route. cluster usage
Went into SQL on Spark UI and see this: SQL UI

For ID 12 enter image description here

For ID 14 is no this step: enter image description here

And in Active Stages here: enter image description here

On those 10 min...an counting only this on the log: 22/02/10 19:24:20 INFO ClusterLoadAvgHelper: Current cluster load: 1, Old Ema: 1.0, New Ema: 1.0

Any idea of how could I understand what's happening here? Thanks!!!
Alejandro
  • 519
  • 1
  • 6
  • 32
  • I'm also facing the same issue. Did you get any solution of it? – J_V Jun 02 '22 at 07:33
  • for me it looks like some sort of timeout. I usually get this error for almost exact 120 seconds. After that i sometimes see logs like this: "INFO TransportClientFactory: Found inactive connection to /10.101.13.197:40759, creating a new one." – bastian Dec 13 '22 at 14:49
  • any luck with this? – Nebi M Aydin Jul 17 '23 at 18:56
  • It was a MERGE without partition pruning, my bad, looking at it now makes a lot of sense, thanks! – Alejandro Jul 24 '23 at 15:17

1 Answers1

0

You can check the driver logs of spark - the stderr, stdout and log4j output. It could be a GC Allocation failure.

You can also check the executors tab in spark UI. It could give you insights on what part of the code is spark stuck on.

Anmol Deep
  • 463
  • 1
  • 5
  • 16