In adjusting the domain of a function to find certain parameters in a matplotlib plot, I found that when I try to isolate the part I need, the output becomes so small that details are impossible to see. I've tried refreshing the kernel with no change and plt.rcParams['figure.figsize'] hasn't been effective either.
This is my current code, with unused options in the function removed.
import numpy as np
import matplotlib.pyplot as plt

def P_cubic(V,T,Tc,Pc,ParamSet,omega=0):
    R = 8.31446261815324 #J mol^-1 K^-1

    Tr = T/Tc

    if ParamSet == 'vdW':

    elif ParamSet == 'RK':

    elif ParamSet == 'SRK':

    elif ParamSet == 'PR':
        alpha   = (1+(0.37464+1.54226*omega-0.26992*omega**2)*
                   (1-Tr**(1/2)))**2
        sigma   = 1+np.sqrt(2)
        epsilon = 1-np.sqrt(2)
        Omega   = 0.07780
        Psi     = 0.45724
        Zc      = 0.30740

    a   = Psi*alpha*R**2*Tc**2/Pc
    b   = Omega*T*Tc/Pc #m3 mol-1

    P = R*T/(V-b)-a/((V+epsilon*b)*(V+sigma*b))
    return P

Tc    = 512.5    #K
Pc    = 8.0840E6 #Pa
omega = 0.565831

T = 473 #K

b = 0.07780*T*Tc/Pc #m3 mol-1

V = np.arange(0,1,0.001)
Vrange = b*V #m3 mol-1

PPa = np.empty(len(Vrange))
for i in range(len(Vrange)):
    PPa[i]=P_cubic(Vrange[i],T,Tc,Pc,'PR',omega) #Pa

Pbar = PPa*1.0E-5 #bar

plt.rcParams['figure.figsize']=(1,0.8)
plt.plot(V,Pbar)
plt.xlabel('V/b')
plt.ylabel('P /bar')
plt.xlim(0,np.max(V))
plt.ylim(np.min(Pbar),np.max(Pbar))
plt.title('Variance of Pressure with Volume of Pure Methanol at 473 K')
plt.text(15,-6,f'b = {b:.2E} m^3/mol');
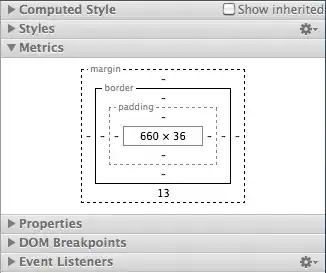
Below are screenshots with the output at varying figsize parameters to show that plt.rcParams['figure.figsize'] is not helping.


 How do I fix this so that I can see the details of the plot?
