1

I'm trying to plot a datafile with dashed lines. Here are some of the values:

2001 dic 21 5,9 9,2 3,8 0,2
2001 dic 22 6,8 8,7 4,8 4,2
2001 dic 23 6,3 8,1 6,5 6,8
2001 dic 24 3,1 4,1 3
2001 dic 25 -1, 3,5 -5
2001 dic 26 4,5 8 0,8 14,8
2001 dic 27 4 7 2,7 0,2
2001 dic 28 0,1 3,4 -3,5
2001 dic 29 7 10,7 2,9 6,2
2001 dic 30 11,2 12,9 8 1,4
2001 dic 31 5,2 6,3 5 3,4
2002 gen 1 2,9 6,9 0,8 
2002 gen 2 -0,8 5,4 -5,4 
2002 gen 3 2,0 8,0 -1,8 
2002 gen 4 2,0 5,2 0,1 
2002 gen 5 -0,8 5,5 -5,2 
2002 gen 6 0,3 6,7 -4,3 
2002 gen 7 0,5 5,6 -3,4 
2002 gen 8 1,2 7,9 -3,3 
2002 gen 9 1,9 8,4 -2,8 
2002 gen 10 1,8 8,1 -2,7 
2002 gen 11 3,6 7,7 -0,7 
2002 gen 12 6,0 10,2 3,5 

For avoiding confusion with other graphs, I should plot not exactly dashed lines but beads ('°'). Gnuplot permits only ".-_" for user-defined dashed lines. Plotting with user-defined linespoints could be the solution but there you have lines and beads, not just 'beads', something like this (look at the plot in the middle): 3 graph plot

To plot with just user-defined points leaves a lot of empty spaces between the beads. So I'm trying to create a new datafile with many more values obtained by linear interpolation of the primitive datafile values, to fill those empty spaces (the first three columns are timestamp data of the kind '2022 feb 28' and the like):

set table $Temp
     plot "datafile.csv" u 1:4:5:6:7 skip 15 w table 
unset table

set print $Temp2  #this file is like $Temp with lots of values added by interpolation   
  do for [i = 1:|$Temp|-1] { 
  print $Temp[i:($1)],$Temp[i:($4)]
              do for [j = 1,10] { print $Temp[i:($1)]+($Temp[i+1:($1)]-$Temp[i:($1)])*j/11), $Temp[i:($4)]+($Temp[i+1:($4)]-$Temp[i:($4)])*j/11) }
              } 
  print $Temp[|$Temp|:($1)],$Temp[|$Temp|:($4)]  
    set print

Obviously this does not work since I'm not handling the columns of the $Temp file correctly. Looking up "arrays" in gnuplot manual does not provide any hint. At the end, the resulting file should be plotted with points pt "°".

theozh
  • 22,244
  • 5
  • 28
  • 72
ifffam
  • 59
  • 6
  • Can you please show a graph of the data and give a data example (in text)? – theozh Mar 01 '22 at 06:15
  • 1
    So, I understand that plotting `with linespoints pointtype 6` (empty circles) is as well no option for you because you want to have empty circles along the path in a equidistant "dashed" way, correct? – theozh Mar 01 '22 at 09:18
  • 1
    For clarification: Is your data equidistant in x? Do you want to have equidistant beads (in x dimension, or in "radius" dimension, as it would be in a dashed linestyle), or do you always want to have the same number of beads between two data points? – Eldrad Mar 01 '22 at 09:50
  • 1
    Making data distinguishable (without using color, i.e. black-white graph) you have different possibilities: 1. `dashtype` 2. `linewidth` 3. `with linespoints` and `pointtype`. If your *really* want to have symbols at visually equidistant positions *along* the path, it probably will get rather complicated for gnuplot<=5.4 (see resampling: https://stackoverflow.com/q/54362441/7295599 or hatched lines: https://stackoverflow.com/a/57685754/7295599). For gnuplot 5.5 there is a new feature `smooth path` which maybe might simplify it somewhat (see: https://stackoverflow.com/a/70991402/7295599) – theozh Mar 01 '22 at 10:11
  • Exactly, the data is equidistant in x and I would like to have equidistant beads in "x dimension" (not "radius") in a "dashed" way; thus I will have a succession of beads with no empty spaces in between (or very small spaces at the most) – ifffam Mar 01 '22 at 12:56
  • @ifffam equidistant beads in x is not the same as equidistant beads along the path unless you have a horizontal line. I assume you are talking about equidistant beads *along the path* which would be comparable to dashing a line. – theozh Mar 01 '22 at 15:21
  • 1
    I suspect getting equidistant beads along the path will be terribly cumbersome in gnuplot, you might be better off at posting a feature request for including circles as a dash pattern on sourceforge... Anyway, in addition to @theozh's suggestions for distinguishable styles there is a 4. option: `using 1:($2-):($2+) w filledcurves between fillstyle pattern `. Not an answer to your question, but maybe it will suffice as a workaround. – Eldrad Mar 01 '22 at 16:00
  • @theozh both ways may be ok, the easiest the best... after all, all I need is a bunch of additional data. – ifffam Mar 01 '22 at 18:51
  • 1
    @ifffam I'm sorry for the confusion, just substitute `` by some integer, `1`, `2` etc. The fill pattern will depend on the terminal you use, so you will probably need to test a few of them. – Eldrad Mar 01 '22 at 20:10
  • @Eldrad the word "between" is not recognized... I get an error message "unexpected or unrecognized token: between" but just removing it, it works. The result is acceptable, though it would be better with beads; I appreciate the suggestion of posting a feature request, namely circles as dash pattern. – ifffam Mar 01 '22 at 20:51
  • @ifffam That might be a version issue, however, I couldn't find which version introduced `between`. – Eldrad Mar 02 '22 at 09:40
  • @Eldrad at least in gnuplot 5.4.1 I can't find `between`. I thought `u 1:2:3 w filledcurves` is always between curves `2` and `3`. Which version are you using? – theozh Mar 02 '22 at 15:21
  • @theozh I'm using 5.5, and `between` is the default behaviour for 3 columns, so omitting it is perfectly fine. Funnily, it's not mentioned in the change log… – Eldrad Mar 02 '22 at 16:10

2 Answers2

1

Edit: Since I changed the question title to "...different pointtypes...", I should show how to do it with multiple columns and different pointtypes. The data of multiple columns is interpolated along the path and appended to the datablock $DashMultipleCols as (sub-)blocks which can later be addressed via index. I leave it up to you to decide whether solid/dash/dotted or plus/circle/triangle is easier to distinguish.

The following example creates a datablock with equidistant points along a given path.

  • for illustration some random test data is created with 1 x-column and 3 y-columns

  • for comparison the first graph is with solid, dashed and dotted lines. To my opinion the lines can be well distinguished, but you asked for "dashing" with a symbol.

  • for the second plot the data of columns 2,3,4 is "dashed" with the pointtypes 1,6,8, respectively.

  • the distance between the symbols is set by a variable, here: Dist = 8

  • in order to get a visually equal distribution, coordinate conversions from x,y to pixel coordinates and reverse are used. For this, the gnuplot variables GPVAL... are used which are available after plotting. That's why it is necessary to plot twice. The command pause -1 can be removed.

  • this works for linear axes (would need adjustment for logarithmic axes)

  • Your data is timedata. The code needs to be adjusted accordingly.

Code: (tested with wxt terminal)

### "dashing" with symbols equidistantly along a path
reset session

# create some random test data
set print $Data
    x0 = 0
    y0 = y1 = y2 = 100
    do for [i=1:10] {
        print sprintf("%g %g %g %g", x0=x0+int(rand(0)*10)+5, y0=y0+int(rand(0)*10)-5, y1=y1+int(rand(0)*10)-5, y2=y2+int(rand(0)*10)-5)
    }
set print

set key top left Left reverse
# plot to get the GPVAL_ ... values
plot $Data u 1:2 w l dt 1 lc "black" ti "Column 2, solid", \
        '' u 1:3 w l dt 2 lc "black" ti "Column 3, dashed", \
        '' u 1:4 w l dt 3 lc "black" ti "Column 4, dotted"

# store GPVAL parameters after plot in variables
txmin = GPVAL_TERM_XMIN
txmax = GPVAL_TERM_XMAX
tymin = GPVAL_TERM_YMIN
tymax = GPVAL_TERM_YMAX
xmin  = GPVAL_X_MIN
xmax  = GPVAL_X_MAX
ymin  = GPVAL_Y_MIN
ymax  = GPVAL_Y_MAX

# x,y to pix and pix to x,y coordinate conversion
XtoPix(x)    = txmin + real(x-xmin)    *(txmax-txmin)/( xmax- xmin)
YtoPix(y)    = tymin + real(y-ymin)    *(tymax-tymin)/( ymax- ymin)
PixToX(scrx) =  xmin + real(scrx-txmin)*( xmax- xmin)/(txmax-txmin)
PixToY(scry) =  ymin + real(scry-tymin)*( ymax- ymin)/(tymax-tymin)

# get lengths and angles in pixel coordinates
set angle degrees
Length(x0,y0,x1,y1) = sqrt((x1-x0)**2 + (y1-y0)**2)
Angle(x0,y0,x1,y1)  = (_dx=x1-x0, _dy=y1-y0, _L=sqrt(_dx**2 + _dy**2), _L==0 ? NaN : \
                      (_dy>=0 ? acos(_dx/_L) : 360-acos(_dx/_L) ))

colX  = 1
colsY = "2 3 4"         # multiple y-columns
do for [colY in colsY] {
    set table $LaA      # table for length and angles
        Total = 0
        plot x1=y1=NaN $Data u (x0=x1,x1=XtoPix(column(colX)),x0):\
                               (y0=y1,y1=YtoPix(column(int(colY))),y0):\
                (L=Length(x0,y0,x1,y1)):(L==L ? Total=Total+L : 0, Angle(x0,y0,x1,y1)) w table
    unset table
    X0(n)        = real(word($LaA[n],1))
    Y0(n)        = real(word($LaA[n],2))
    SegLength(n) = real(word($LaA[n],3))
    SegAngle(n)  = real(word($LaA[n],4))

    # create equidistant datapoints along path
    set print $DashSingleCol
        Dist = 8                    # Distance between symbols
        N = floor(Total/Dist)
        idx = 2
        L0 = 0
        L = SegLength(idx)
        do for [i=0:N] {
            R = i*Dist
            while (L-R<0) {
                L0 = L
                idx = idx + 1
                L = L + SegLength(idx)
            }
            print sprintf("%g %g", PixToX(X0(idx)+(R-L0)*cos(SegAngle(idx))), \
                                   PixToY(Y0(idx)+(R-L0)*sin(SegAngle(idx))))
        }
    set print
    set print $DashMultipleCols append
        print $DashSingleCol
        print "\n\n"
    set print
}

pause -1 

mySymbol(n) = int(word("1 6 8",n))

plot for [i=1:words(colsY)] $DashMultipleCols u 1:2:(mySymbol(i)) index i-1 \
          w p pt mySymbol(i) ps 0.6 lc "black" ti sprintf("Column %s, Symbol %d",word(colsY,i),mySymbol(i))
### end of code

Result:

enter image description here

enter image description here

Addition: Code adapted for time format

The time in gnuplot is nothing else than seconds passed since Jan 1st, 1970 00:00:00. If you enter in the gnuplot console print time(0) (which is the current time) you will get something like 1646757721, so about 1.6 billion seconds have passed since then until today.

The main differences and things to keep in mind compared to the above code:

  • define your specific time format, e.g. myTimeFmt = "%Y %b %d"
  • with this time format and the spaces inbetween, your data will be in columns 4,5, and 6.
  • for plotting the data the first time you use, e.g. plot $Data u (timecolumn(1,myTimeFmt)):4 w l
  • for the length and angle table ($LaA) you also have to use columns 4,5,6 and timecolumn() as well, i.e. plot x1=y1=NaN $Data u (x0=x1,x1=XtoPix(timecolumn(colX,myTimeFmt)),x0)
  • for creating the datablock $DashSingleCol you have to force the format for the time to be "%.0f" i.e. print sprintf("%.0f %g", PixToX(X0(idx)+(R-L0)*cos(SegAngle(idx))). Otherwise, with "%g" gnuplot would write a floating point number with exponent but only 6 digits, e.g. 1.64676e+09 which would be unwanted truncation or rounding.
  • for plotting $DashMultipleCols you can simply use u 1:2 because the time is already in seconds and does not have to be changes via timecolumn().

I hope this additional code and the explanations will help you to "dash" your data with different symbols.

Code:

### "dashing" with symbols equidistantly along a path (with timedata)
reset session

myTimeFmt = "%Y %b %d"

# create some random test data
set print $Data
    t0 = time(0)
    y0 = y1 = y2 = 10
    SecsPerDay =  24*3600   # seconds per day
    do for [i=1:10] {
        t0=t0+int(rand(0)*10*SecsPerDay)+5*SecsPerDay
        print sprintf("%s %g %g %g", strftime(myTimeFmt,t0), \
                y0=y0+int(rand(0)*10)-5, y1=y1+int(rand(0)*10)-5, y2=y2+int(rand(0)*10)-5)
    }
set print

set key top left Left reverse
# plot to get the GPVAL_ ... values
set format x "%b %01d\n%Y" timedate
plot $Data u (timecolumn(1,myTimeFmt)):4 w l dt 1 lc "black" ti "Column 4, solid", \
        '' u (timecolumn(1,myTimeFmt)):5 w l dt 2 lc "black" ti "Column 5, dashed", \
        '' u (timecolumn(1,myTimeFmt)):6 w l dt 3 lc "black" ti "Column 6, dotted"

# store GPVAL parameters after plot in variables
txmin = GPVAL_TERM_XMIN
txmax = GPVAL_TERM_XMAX
tymin = GPVAL_TERM_YMIN
tymax = GPVAL_TERM_YMAX
xmin  = GPVAL_X_MIN
xmax  = GPVAL_X_MAX
ymin  = GPVAL_Y_MIN
ymax  = GPVAL_Y_MAX

# x,y to pix and pix to x,y coordinate conversion
XtoPix(x)    = txmin + real(x-xmin)    *(txmax-txmin)/( xmax- xmin)
YtoPix(y)    = tymin + real(y-ymin)    *(tymax-tymin)/( ymax- ymin)
PixToX(scrx) =  xmin + real(scrx-txmin)*( xmax- xmin)/(txmax-txmin)
PixToY(scry) =  ymin + real(scry-tymin)*( ymax- ymin)/(tymax-tymin)

# get lengths and angles in pixel coordinates
set angle degrees
Length(x0,y0,x1,y1) = sqrt((x1-x0)**2 + (y1-y0)**2)
Angle(x0,y0,x1,y1)  = (_dx=x1-x0, _dy=y1-y0, _L=sqrt(_dx**2 + _dy**2), _L==0 ? NaN : \
                      (_dy>=0 ? acos(_dx/_L) : 360-acos(_dx/_L) ))

colX  = 1
colsY = "4 5 6"         # multiple y-columns
do for [colY in colsY] {
    set table $LaA      # table for length and angles
        Total = 0
        plot x1=y1=NaN $Data u (x0=x1,x1=XtoPix(timecolumn(colX,myTimeFmt)),x0):\
                               (y0=y1,y1=YtoPix(column(int(colY))),y0):\
                (L=Length(x0,y0,x1,y1)):(L==L ? Total=Total+L : 0, Angle(x0,y0,x1,y1)) w table
    unset table
    X0(n)        = real(word($LaA[n],1))
    Y0(n)        = real(word($LaA[n],2))
    SegLength(n) = real(word($LaA[n],3))
    SegAngle(n)  = real(word($LaA[n],4))

    # create equidistant datapoints along path
    set print $DashSingleCol
        Dist = 8                    # Distance between symbols
        N = floor(Total/Dist)
        idx = 2
        L0 = 0
        L = SegLength(idx)
        do for [i=0:N] {
            R = i*Dist
            while (L-R<0) {
                L0 = L
                idx = idx + 1
                L = L + SegLength(idx)
            }
            print sprintf("%.0f %g", PixToX(X0(idx)+(R-L0)*cos(SegAngle(idx))), \
                                   PixToY(Y0(idx)+(R-L0)*sin(SegAngle(idx))))
        }
    set print
    set print $DashMultipleCols append
        print $DashSingleCol
        print "\n\n"
    set print
}

pause -1 

mySymbol(n) = int(word("1 6 8",n))

plot for [i=1:words(colsY)] $DashMultipleCols u 1:2:(mySymbol(i)) index i-1 \
          w p pt mySymbol(i) ps 0.6 lc "black" ti sprintf("Column %s, pointtype %d",word(colsY,i),mySymbol(i))
### end of code

Result:
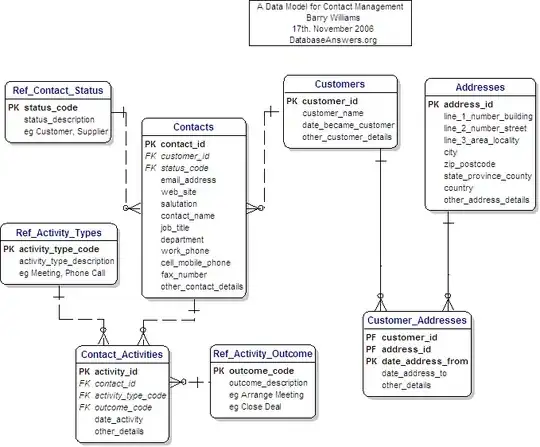
enter image description here

enter image description here

theozh
  • 22,244
  • 5
  • 28
  • 72
  • terrific... that's precisely what I was looking for. I'll try to work it out hopefully tomorrow but the dashed pattern is exactly that one. Even better than '°'. Big thx (I've already clicked on the up arrow; once I apply it to my data, I'll click on the check mark too). – ifffam Mar 02 '22 at 20:39
  • 1
    @ifffam glad to hear. Well, in gnuplot most of the times there is some solution, but sometimes a bit lengthy. Here, you can also use the pointtypes triangles, squares, etc. although if they are getting too small they might be difficult to distinguish. – theozh Mar 02 '22 at 20:42
  • 1
    @ifffam actually, I would suggest a change of the question title to better reflect the actual desire. For example, maybe something like: `How to dash a line using different pointtypes in gnuplot?`. – theozh Mar 02 '22 at 21:35
  • `@theozh` seems to me a good idea, go ahead ! Now let's hope that `smooth linear` will soon be available so as to simplify this procedure (provided that the smooth option permits to plot not only with lines but also with points, which, for the time being, is not possible either). – ifffam Mar 03 '22 at 12:41
  • @ifffam ok, I will change title. Well, I cannot test `smooth linear` in 5.5 because I haven't yet spent time on how to build gnuplot from the source on Windows. So, I have to wait for the binaries. – theozh Mar 03 '22 at 13:06
  • @ifffam I found some 5.5 binaries and tested `smooth path`. But it will not do what we want here. It looks like it uses some Splines or Béziers to approximate the path, i.e. points might not be strictly *on* the path, especially when you only have a few datapoints like in the example above. Actually, `smooth linear` is still an open feature request for equidistant resampling of a curve in x. (https://sourceforge.net/p/gnuplot/feature-requests/518/) – theozh Mar 03 '22 at 13:32
  • 1
    @ifffam sorry, I underestimated the necessary changes for time format. I also had to try a few times until it worked. I will add the code for time format and some additional comments in a few minutes. – theozh Mar 08 '22 at 16:38
  • @ifffam btw, are you working under Windows or Linux? For Windows it is `set locale "italian"`, for Linux (I guess) it is something like `set locale "it_IT"`. Yes, `set xdata time` and `set timefmt myTimeFmt` can make life easier in certain cases but will be limiting in other cases, e.g. when you have multiple date formats. – theozh Mar 15 '22 at 07:46
  • `@theozh` if I `set decimalsign ","` (because my original file comes like that), then `print sprintf("%.0f %g", PixToX(X0(idx)+(R-L0)*cos(SegAngle(idx))), \ PixToY(Y0(idx)+(R-L0)*sin(SegAngle(idx))))` gives me an error, "undefined value" (pointing to `sprintf`). Would it be simple to fix that ? (if not, I could create another $Data file with set table to rebuild my original data file with decimalsign ".") I need that since I have to replot my original file (with ",") along with your $Dash MultipleCols file (with ".") – ifffam Mar 17 '22 at 20:25
  • @ifffam if you `set decimalsign ","` it will not have an effect on input data decimal sign (check `help decimalsign`. Ah, sorry, I guess I misled you: `set locale "italian"` apparently will set e.g. the names of months and days to Italian, but I you have to use `set decimalsign local "italian"` (or `german` or `french`) for allowing the comma for input data. – theozh Mar 17 '22 at 20:51
  • `@theozh`no, elsewhere you told me right: to use`set decimalsign locale "italian"`for input (to plot my original datafile at the beginning to get the GPVAL_'s), then `set decimalsign "."`(for output) and`set decimalsign locale "English"`for the rest of your code. Now, I must plot my original datafile (",") together with your $DashMultipleCols file (".") in the same box of a multiplot. The simplest thing would be to`set decimalsign locale "italian"`at the beginning thus making input and output decimalsign a comma, but then print sprintf doesn't work and gprintf (split) gives me 'undefined value – ifffam Mar 18 '22 at 16:29
  • `@theozh` I must include your code in a do loop (for years from 2000 to 2021): Y2K works fine, but when I pass to year 2001 (and xrange changes accordingly), it does not plot your generated $DashMultipleCols file since the file is not erased when passing from Y2K to 2001 but it just accumulates Y2K data and Y2001 data: do you know how to erase/reset $DashMultipleCols when the do loop passes from Y2K to Y2001 ? I have searched on the manual but I've found nothing ('erase' doesn't exist, and 'clear' and 'reset' are for other stuff). – ifffam Mar 31 '22 at 12:15
  • 1
    @ifffam check `help undefine`. So you could do, e.g. `undefine $Datablock` or alternatively `set print $Datablock; set print`. – theozh Mar 31 '22 at 14:12
0

set xdata time is just fine. set timefmt myTimeFmt is ok ONLY for setting xrange and xtics with that same timedate format. Then, right before plotting, set timefmt must be modified according to the timedate format of the file to plot (that is, $DashMultipleCols), which in this case is seconds; therefore set timefmt "%s".

ouflak
  • 2,458
  • 10
  • 44
  • 49
ifffam
  • 59
  • 6