6

Ahead of a the programming question, I believe I need to give a little background of what I am doing to ease the understanding of my problem :

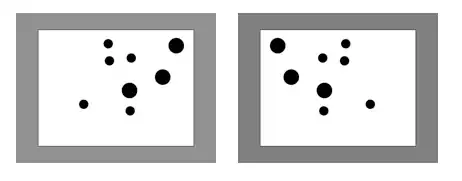
I record eye-movements while displaying some patterns to subjects subject. Through the experiment, I later display some symmetrical transform of those patterns.

enter image description here

What I get is lists of fixations coordinates and durations :

{{fix1X,fix1Y,fix1Dn},{fix2X,fix2Y,fix2Dn},...{fixNX,fixNY,fixNDn}}

Where :

-fix1X is the X coordinate for the first fixation.

-fix1Y is the Y coordinate for the first fixation.

-fix1D is the duration in milliseconds of the fixations

Please consider :

FrameWidth  = 31.36;
scrHeightCM = 30;
scrWidthCM  = 40;
FrameXYs    = {{4.32, 3.23}, {35.68, 26.75}};  (* {{Xmin,Ymin},{Xmax,Ymax}} *)

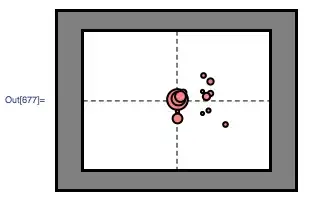
Below are the fixations for 1 Display (Subject Fixations during the 3s stimuli presentation on the screen)

fix ={{20.14, 15.22, 774.}, {20.26, 15.37, 518.}, {25.65, 16.22, 200.}, 
      {28.15, 11.06, 176.}, {25.25, 13.38, 154.}, {24.78, 15.74, 161.}, 
      {24.23, 16.58, 121.}, {20.06, 13.22, 124.}, {24.91, 15.8, 273.}, 
      {24.32, 12.83, 119.}, {20.06, 12.14, 366.}, {25.64, 18.22, 236.}, 
      {24.37, 19.2, 177.}, {21.02, 16.4, 217.}, {20.63, 15.75,406.}}

Graphics[{
          Gray, EdgeForm[Thick],
          Rectangle @@ {{0, 0}, {scrWidthCM, scrHeightCM}},
          White,
          Rectangle @@ StimuliFrameCoordinates,
          Dashed, Black,
         Line[
             {{(scrWidthCM/2), FrameXYs[[1, 2]]},
             {(scrWidthCM/2), FrameXYs[[2, 2]]}}],
         Line[
             {{FrameXYs[[1, 1]], (scrHeightCM/2)},
             {(FrameXYs[[2, 1]]), (scrHeightCM/2)}}],

         Thickness[0.005], Pink,
         Disk[{#[[1]], #[[2]]}, 9 N[#[[3]]/Total[fix[[All, 3]]]]] & /@ fix
         }, ImageSize -> 500]

enter image description here

What I want to do :

I would like to "discretize" the stimuli frame space into clusters :

Below is a visual representation (done in PPT) with different clusters (2,4,16,64).

The colored part representing the clusters in which fixations occurred :

enter image description here

With this I want to

-Count the number of fixations within each cluster.

-Compute the presence/count or duration observed in each cluster.

A Matrix form would easily enable me to compare different displays fixations by subtraction.

So, question(s)

-How can I create a flexible mechanism to divide the stimuli frame into clusters.

-Map the fixations onto those clusters obtaining a rectangular Matrix filled with 0s or fixations counts or total fixations duration for each of the matrix cell.

I feel this question could be unclear and will edit it to clarify anything needed. Also, would you think this should be asked in 2 separate questions, I am happy to do so.

Many thank in advance for any help you could provide.

500
  • 6,509
  • 8
  • 46
  • 80
  • 1
    What size do the various subdivisions have? Are they an integer number of pixels? Your examples show a 1:2:4:8 subdivision. Should we conclude that the required subdivisions are all powers of 2? Why in the first example have you divided the screen horizontally but not vertically? Does that imply that the subdivisions should be done independently in the horizontal and vertical direction? How do you count a fixation on a boundary? What about the center of the screen? I suppose it's in the corner of the 4 squares around it as shown or is it in the center of a square in the center of the screen? – Sjoerd C. de Vries Aug 20 '11 at 17:58
  • @Sjoerd, Thank You. I would like to test different size of subdivision. Yes they should be an integer number of Pixel. 1cm is 32 Pixels on the monitor I am using. I think powers of 2 for the subdivisions is the way to go, but would be happy to hear your thoughts on this. The first example of division is a mistake. How to count a fixation on a boundary is puzzling me. The only thing that come to my mind now would be to give 1/2 and 1/2 to the adjacent subdivisions. – 500 Aug 20 '11 at 18:31
  • @500 - Suggestion... Once you figure out how to partition the space, how about using a 'heat map' to visualize the intensity of fixation? Check these links out for some MMA code: http://mathgis.blogspot.com/2010/01/more-on-heatmap.html and http://mathgis.blogspot.com/2010/01/charting-time-series-as-calendar-heat.html Here's another one: http://omarsscripts.wordpress.com/2009/01/12/how-to-make-a-heatmap-in-mathematica/ – telefunkenvf14 Aug 21 '11 at 13:17

3 Answers3

8

You can do something like:

createMatrix[list_, frameXYs_, partitX_, partitY_, fun_] :=
 Module[{matrix},
  (*init return matrix*)
  matrix = Array[0 &, {partitX, partitY}];
  (matrix[[
    IntegerPart@Rescale[#[[1]], {frameXYs[[1, 1]], frameXYs[[2, 1]]}, {1,partitX}],
    IntegerPart@Rescale[#[[2]], {frameXYs[[1, 2]], frameXYs[[2, 2]]}, {1,partitY}]
         ]] += fun[#[[3]]]) & /@ list;

  Return@(matrix[[1 ;; -2, 1 ;; -2]]);]

Where fun is the counting function on the third dimension of your list.

So, if you want to count occurrences:

fix = {{20.14, 15.22, 774.}, {20.26, 15.37, 518.}, {25.65, 16.22, 200.}, 
       {28.15, 11.06, 176.}, {25.25, 13.38, 154.}, {24.78, 15.74, 161.}, 
       {24.23, 16.58, 121.}, {20.06, 13.22, 124.}, {24.91, 15.8,  273.}, 
       {24.32, 12.83, 119.}, {20.06, 12.14, 366.}, {25.64, 18.22, 236.}, 
       {24.37, 19.2, 177.},  {21.02, 16.4, 217.},  {20.63, 15.75, 406.}};
FrameXYs = {{4.32, 3.23}, {35.68, 26.75}};

cm = createMatrix[fix, FrameXYs, 10, 10, 1 &]
MatrixPlot@cm
MatrixForm@cm

enter image description here

And if you want to add up fixation time

cm = createMatrix[fix, FrameXYs, 10, 10, # &]
MatrixPlot@cm
MatrixForm@cm

enter image description here

Edit

Making some adjustments in the indexes, a little code embellishment, an a clearer example:

createMatrix[list_, frameXYs_, partit : {partitX_, partitY_}, fun_] :=
 Module[{matrix, g},
  (*Define rescale function*)
  g[i_, l_] := IntegerPart@
                   Rescale[l[[i]], (Transpose@frameXYs)[[i]], {1, partit[[i]]}];
  (*Init return matrix*)
  matrix = Array[0 &, {partitX + 1, partitY + 1}];
  (matrix[[g[1, #], g[2, #]]] += fun[#[[3]]]) & /@ list;
  Return@(matrix[[1 ;; -2, 1 ;; -2]]);]

.

fix = {{1, 1, 1}, {1, 3, 2}, {3, 1, 3}, {3, 3, 4}, {2, 2, 10}};
FrameXYs = {{1, 1}, {3, 3}};
cm = createMatrix[fix, FrameXYs, {7, 7}, # &];
MatrixPlot@cm
Print[MatrixForm@SparseArray[(#[[1 ;; 2]] -> #[[3]]) & /@ fix], MatrixForm@cm]

enter image description here

Dr. belisarius
  • 60,527
  • 15
  • 115
  • 190
  • Thank You very much I am looking into it now, it`s really cool ! – 500 Aug 20 '11 at 18:39
  • It never let me know that another answer was posted! Yours is definitely simpler. But, I got to use my swiss army knife `SelectEquivalents` again, so I'm happy. – rcollyer Aug 20 '11 at 19:02
  • 1
    +1, After looking through it, I have to admit I am duly impressed with the elegance of supplying `1&` or `#&` to achieve the counts and timings. But, what if you want mean/std deviation for the timings? – rcollyer Aug 20 '11 at 19:12
  • @rcollyer I guess you could use on-line algorithms like [these](http://en.wikipedia.org/wiki/Algorithms_for_calculating_variance#On-line_algorithm) – Dr. belisarius Aug 21 '11 at 00:16
4

There are a couple of things that have to be done to accomplish what you want. First, given a division count we have to divide up the 2-dimensional space. Second, using the division count, we need a flexible method of grouping the fixations into their appropriate spots. Lastly, we generate whatever statistics you need.

As to the division count, the built-in function FactorInteger almost does what you need. For example,

(* The second parameter is the upper limit for the number of factors returned *)
FactorInteger[35,2] == {{5,1}, {7,1}}
FactorInteger[64,2] == {{2,6}}

Unfortunately, you can only specify an upper limit to the number of factors returned, so we must modify the output slightly

Clear[divisionCount]
divisionCount[c_Integer?(Positive[#] && (# == 2 || ! PrimeQ[#]) &)] :=
With[{res = FactorInteger[c, 2]},
 Power @@@ If[ 
     Length[res] == 2, 
     res // Reverse,
     With[
       {q = Quotient[res[[1, 2]], 2], r = Mod[res[[1, 2]], 2], 
        b = res[[1, 1]]},
       {{b, q + r}, {b, q}}
     ]
 ]
] 

This does two things, replaces {{b,m}} with {{b, m / 2 + m mod 2}, {b, m / 2}} where / represents integer division (i.e. there are remainders) and converts {{b, m} ..} to {b^m ..} via Power @@@. This gives

divisionCount[32] == {8, 4}
divisionCount[64] == {8, 8}.

It turns out, we can get a fixation count at this point with minimal additional work via BinCounts, as follows

BinCounts[fix[[All,;;2]], (* stripping duration from tuples *)
  {xmin, xmax, (xmax - xmin)/#1,
  {ymin, ymax, (ymax - ymin)/#2]& @@ divisionCount[ divs ]

where you need to supply the ranges for x and y and the number of divisions. However, this isn't as flexible as it could be. Instead, we'll make use of SelectEquivalents.

The key to using SelectEquivalents effectively is creating a good categorization function. To do that, we need to determine the divisions ourselves, as follows

Clear[makeDivisions]
makeDivisions[
 {xmin_, xmax_, xdivs_Integer?Positive}, {ymin_, ymax_, ydivs_Integer?Positive}] :=
   Partition[#,2,1]& /@ {
     (xmax - xmin)*Range[0, xdivs]/xdivs + xmin,
     (ymax - ymin)*Range[0, ydivs]/ydivs + ymin
   }

makeDivisions[
       {xmin_, xmax_}, {ymin_, ymax_}, 
       divs_Integer?(Positive[#] && (# == 2 || ! PrimeQ[#]) &)] :=
 makeDivisions[{xmin, xmax, #1}, {ymin, ymax, #2}] & @@ divisionCount[divs]

where

makeDivisions[{0, 1}, {0, 1}, 6] == 
 {{{0, 1/3}, {1/3, 2/3}, {2/3, 1}}, {{0, 1/2}, {1/2, 1}}}.

(I would have used FindDivisions, but it doesn't always return the number of divisions you request.) makeDivisions returns two lists where each term in each list is a min-max pair that we can use to determine if a point falls into the bin.

Since we are on a square lattice, we need to test all pairs of limits that we just determined. I'd use the following

Clear[inBinQ, categorize]
inBinQ[{xmin_,xmax_}, {ymin_, ymax_}, {x_,y_}]:= 
   (xmin <= x < xmax) && (ymin <= y < ymax)

categorize[{xmin_, xmax_}, {ymin_, ymax_}, divs_][val : {x_, y_, t_}] := 
 With[{bins = makeDivisions[{xmin, xmax}, {ymin, ymax}, divs]}, 
  Outer[inBinQ[#1, #2, {x, y}] &, bins[[1]], bins[[2]], 1]] //Transpose

which returns

categorize[{0,1},{0,1},6][{0.1, 0.2, 5}] ==
 {{True, False, False}, {False, False, False}}.

Note, the y-coordinate is reversed compared to the plot, low values are at the beginning of the array. To "fix" this, Reverse bins[[2]] in categorize. Also, you'll want to remove the Transpose prior to supplying the results to MatrixPlot as it expects the results in an untransposed form.

Using

SelectEquivalents[ 
 fix, 
 (categorize[{xmin, xmax}, {ymin, ymax}, 6][#] /. {True -> 1, False -> 0} &), 
 #[[3]] &, (* strip off all but the timing data *)
{#1, #2} &],

we get

{{
  {{0, 0, 0}, {0, 1, 0}}, {774., 518., 161., 121., 273., 177., 217., 406.}
 }, 
 {
  {{0, 0, 0}, {0, 0, 1}}, {200., 236.}
 }, 
 {
  {{0, 0, 1}, {0, 0, 0}}, {176., 154.}
 }, 
 {
  {{0, 1, 0}, {0, 0, 0}}, {124., 119., 366.}
 }}}

where the first term in each sublist is a matrix representation of the bin and the second term is a list of points that fall in that bin. To determine how many are in each bin,

Plus @@ (Times @@@ ({#1, Length[#2]} & @@@ %)) ==
 {{0, 3, 2}, {0, 8, 2}}

Or, timings

Plus @@ (Times @@@ ({#1, Total[#2]} & @@@ %)) ==
 {{0, 609., 330.}, {0, 2647., 436.}}

Edit: As you can see, to get whatever statistics you need on the fixations, you just have to replace either Length or Total. For instance, you could want the average (Mean) time spent, not just the total.

Community
  • 1
  • 1
rcollyer
  • 10,475
  • 4
  • 48
  • 75
  • @ rcollyer & belisarius, if you are around.rclloyer, I must admit your code is a little intense to me :-) However, your comment suggested it enables stats such as mean/std that belisarius`s code could not. And i will need indeed to to do some. What do you think ? They seems really 2 different approaches. – 500 Aug 20 '11 at 23:18
  • @500, yes, the code is a little overwhelming. I tend to tackle my problems that way, and they're not always the simplest solutions. But, they're flexible. Also, I'm sorry I had implied that Belisarius' code could not handle, but it isn't true. It just requires using a different set of algorithms, see his link after his post. – rcollyer Aug 21 '11 at 01:40
3

Depending on the calculations you are performing, and the precision of the data, you may care for a softer approach. Consider using image resampling for this. Here is one possible approach. There is obvious fuzziness here, but again, that may be desirable.

fix = {{20.14, 15.22, 774.}, {20.26, 15.37, 518.}, {25.65, 16.22, 
    200.}, {28.15, 11.06, 176.}, {25.25, 13.38, 154.}, {24.78, 15.74, 
    161.}, {24.23, 16.58, 121.}, {20.06, 13.22, 124.}, {24.91, 15.8, 
    273.}, {24.32, 12.83, 119.}, {20.06, 12.14, 366.}, {25.64, 18.22, 
    236.}, {24.37, 19.2, 177.}, {21.02, 16.4, 217.}, {20.63, 15.75, 
    406.}};
FrameXYs = {{4.32, 3.23}, {35.68, 26.75}};

Graphics[{AbsolutePointSize@Sqrt@#3, Point[{#, #2}]} & @@@ fix, 
 BaseStyle -> Opacity[0.3], PlotRange -> Transpose@FrameXYs,
 PlotRangePadding -> None, ImageSize -> {400, 400}]

ImageResize[%, {16, 16}];

Show[ImageAdjust@%, ImageSize -> {400, 400}]

scaled dots

resampled raster


As the above is apparently unhelpful, here is an attempt to be constructive. This is my take on belisarius' fine solution. I feel that it is a little cleaner.

createMatrix[list_, {{x1_, y1_}, {x2_, y2_}}, par:{pX_, pY_}, fun_] :=
 Module[{matrix, quant},
    matrix = 0 ~ConstantArray~ par;
    quant = IntegerPart@Rescale@## &;
    (matrix[[
         quant[#1, {x1, x2}, {1, pX}],
         quant[#2, {y1, y2}, {1, pY}]
           ]] += fun[#3] &) @@@ list;
    Drop[matrix, -1, -1]
 ]

Notice that the syntax is slightly different: quantize partitions x and y are given in a list. I feel this is more consistent with other functions, such as Array.

Mr.Wizard
  • 24,179
  • 5
  • 44
  • 125
  • Mr.Wizard,Thank You. Basically, I need to find the "distance" between matrices of eye fixations for different conditions. I hope to find that the fixations recorded for different flips of a same pattern are significantly more similar that random permutations of fixations across different patterns. Also, I will probably look at the sequence of the fixations. In addition to "static" similarity (or not), maybe there is similarities in the way the fixations build up. It is abstract but it is to give you an idea :-) – 500 Aug 20 '11 at 23:14
  • the plots above are very cool to me, I actually spend most of my the plotting and just came to realize I had to do "real stats" ! – 500 Aug 21 '11 at 01:07
  • Mr.Wizard,I am struggling with Color Function in MatrixPlot. I would really love to obtain something like you did above going from White to Black, but can`t figure out how from your code ! – 500 Aug 21 '11 at 16:54
  • @500 Finding a good metric to measure meaningful "distances" between fixation sequences seems not trivial at all! – Dr. belisarius Aug 21 '11 at 21:32
  • @belisarius, Ah ! if not irony, some empathy ;-) I find this matrix form extremely convenient, although I am not comfortable manipulating them yet. Building new questions ! – 500 Aug 21 '11 at 22:02
  • @500 Perhaps you could start with Mr. Wizard´s idea and trying to use `ImageCorrelation[]` on the resulting images – Dr. belisarius Aug 21 '11 at 22:33
  • @Belisarius, Ok I will try that one. I found only ImageCorrelate. Is that what you are thinking about ? – 500 Aug 21 '11 at 23:25
  • @500, for "distance", I'd start by looking at [matrix norms](http://en.wikipedia.org/wiki/Matrix_norm), but they're likely not what you need. Instead, you could `Flatten` your matrix, and by treating them as vectors, you can calculate `|A - B|`, where `||` is an inner product. – rcollyer Aug 22 '11 at 14:59
  • @rcollyer I think he will need something more "statistical". When a fixation pattern is displaced "one column to the left", the matching should be almost perfect. Any measure derived only from an inner product will be zero. – Dr. belisarius Aug 22 '11 at 20:06
  • @belisarius, good point. I'd then suggest looking at its moments, especially the mean and 2nd, and higher, moments about the mean. – rcollyer Aug 22 '11 at 20:11