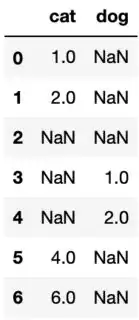
I'm trying to use seaborn to make lineplots of a few variables, but I'm trying to make sure that lines are segmented when not continuous. Example below:
df = pd.DataFrame([[1, np.nan], [2, np.nan], [np.nan, np.nan],
                   [np.nan, 1], [np.nan, 2], [4, np.nan], [6, np.nan]],
                   columns=['cat', 'dog'])
display(df)
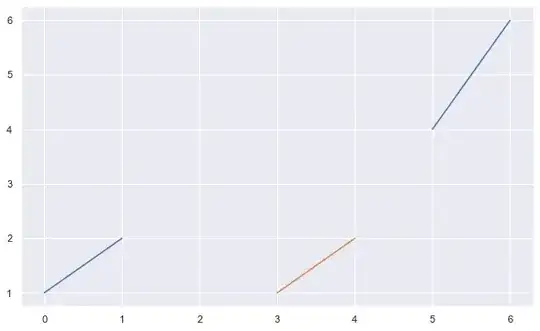
plt.plot(df['cat'])
plt.plot(df['dog'])
When I try to do the plotting in seaborn I get:
sns.lineplot(data=df)
Or using the dataframe format that I prefer:
df = pd.DataFrame([[1, 'cat'],[2, 'cat'], [np.nan, np.nan],
                   [1, 'dog'], [2, 'dog'], [4, 'cat'], [6, 'cat']],
                   columns=['value', 'type'])
display(df)
sns.lineplot(data=df, x=df.index, y='value', hue='type')
SO... Is there a way to do a seaborn plot that looks piecewise like the first plot that was created using matplotlib/pyplot? Can it be done using the 2nd dataframe format with a value column and a category column?


