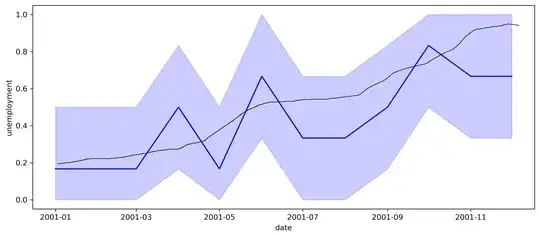
I have a dataframe like this. I drawed Seaborn Line plot but the graph is not that i want.
This is my dataframe and code.
import matplotlib.pyplot as plt
import pandas as pd
import seaborn as sns
import datetime as dt

data = {'year': ['2001', '2001', '2001', '2001', '2001', '2001','2001', '2001', '2001', '2001', '2001', '2001','2001', '2001', '2001', '2001', '2001', '2001','2001', '2001', '2001', '2001', '2001', '2001','2001', '2001', '2001', '2001', '2001', '2001','2001', '2001', '2001', '2001', '2001', '2001','2001', '2001', '2001', '2001', '2001', '2001','2001', '2001', '2001', '2001', '2001', '2001','2001', '2001', '2001', '2001', '2001', '2001','2001', '2001', '2001', '2001', '2001', '2001','2001', '2001', '2001', '2001', '2001', '2001','2001', '2001', '2001', '2001', '2001', '2001'],
        'month': ['1','1','1','1','1','1','2', '2', '2', '2', '2','2',  '3', '3', '3', '3', '3', '3', '4', '4', '4', '4', '4', '4', '5', '5', '5', '5', '5', '5', '6', '6', '6', '6', '6', '6','7','7','7','7','7','7', '8', '8', '8', '8', '8', '8', '9', '9', '9', '9', '9', '9', '10', '10', '10', '10', '10', '10', '11', '11', '11', '11', '11', '11', '12', '12', '12', '12', '12', '12'],
        'unemployment': [0, 0, 0, 0, 0,1,0, 0, 0, 0, 0,1,0, 0, 0, 0, 0,1,0, 1, 1, 0, 0,1,0, 0, 0, 0, 0,1,0, 1, 1, 1, 0,1,0, 0, 0, 1, 0,1,0, 0, 1, 0, 0,1,0,1 , 1, 0, 0,1,0, 1, 1, 1, 1,1,0, 0,1, 1, 1,1,0, 0, 1, 1, 1,1 ]
        }

df = pd.DataFrame(data)

print (df)

date=pd.to_datetime(df['year'].astype(str)  + df['month'].astype(str), format='%Y%m')

df['date']=date

# set figure size
plt.figure( figsize = ( 12, 5))

# plot a simple time series plot
# using seaborn.lineplot()
sns.lineplot( x = 'date',
            y = 'unemployment',
            data = df,
            color="blue")
Output is this.
However, I want to fit smooth line plot like this.
I tried to use "scipy.interpolate.spline" but my code didn't work.Any Idea?Thanks in advance.

