I'm trying to use double curly brackets in a function that makes a timeseries plot, and I've hit a wall, despite reading this overview on how double curly brackets generally work.
In this function, users specify the time period that they want the plot to focus on (week or month). If the user chooses "Month", then the plot's X axis should be the Month date, and the Y axis should be the Month_score column.
I thought I understood how this worked, but my plot shows no data:
library(dplyr)
library(ggplot2)
library(lubdridate)
#Sample data
test <- tibble(Week = seq(as.Date("2014/09/04"), by = "week", length.out = 8),
Month = ymd(rep('2014-09-01', 4), rep('2014-10-01', 4)),
Week_score = c(2, 3, 4, 6, 5, 7, 8, 9),
Month_score = c(15, NA, NA, NA, 29, NA, NA, NA))
#My function
make_time_plot <- function(data, time_period = c("Week", "Month")) {
time_period_score <- paste0(time_period, "_score")
data %>%
ggplot(aes(x = {{time_period}}, y = {{time_period_score}})) +
geom_line()
}
#Proof that it doesn't work :-(
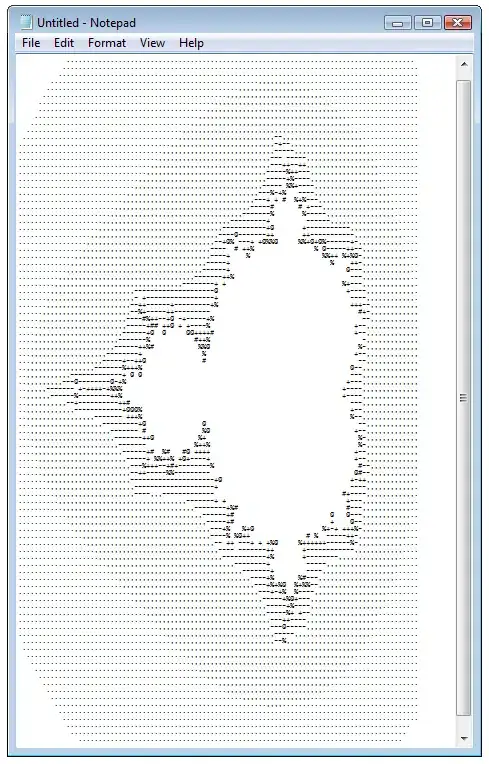
make_time_plot(data = test, time_period = "Month")
Comically Wrong Output: