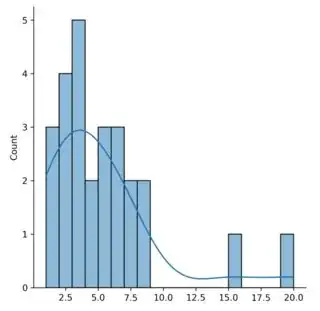
When there are outliers in a list of numbers, the last bins of its histogram are short and sparse. Thus, I want to have the last bin to use a range. For this example, it would be 10+ to include all values larger than 10.
import seaborn as sns
import matplotlib.pyplot as plt
l = [1,2,3,4,5,1,2,3,6,7,8,6,4,5,3,2,8,3,1,2,3,5,6,7,15,20]
sns.displot(l, binwidth = 1, kde=True, rug=False)
plt.show()
The histogram of the list above
I haven't figured out how to do it with seaborn. If matplotlib would work, that is also terrific. Many thanks in advance!

