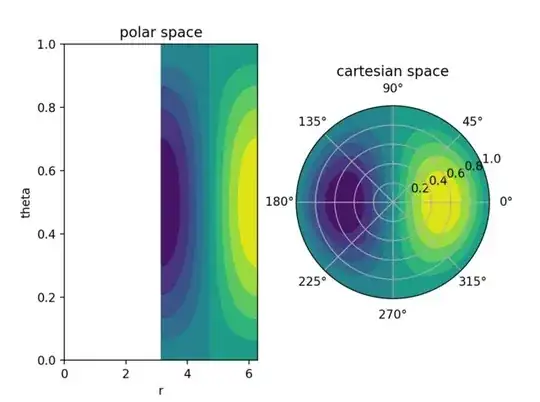
Consider the following data, which is defined in polar space in theta, r, and is plotted twice; once in the the orthogonal theta-r phase space, and one in cartesian space after an inverse transformation from polar coordinates to x-y (i.e. what matplotlib's projection='polar' does):
import matplotlib.pyplot as plt
import numpy as np

theta = np.linspace(0, 2*np.pi, 50)
r = np.linspace(0, 1, 50)
THETA, R = np.meshgrid(theta, r)
Z = np.sin(R*np.pi) * np.sin(THETA+np.pi/2)

fig = plt.figure()
axpol = fig.add_subplot(121)
axcart = fig.add_subplot(122, projection='polar')

axcart.contourf(THETA, R, Z, levels=10)
axpol.contourf(THETA, R, Z, levels=10)

axcart.set_title('cartesian space')
axpol.set_title('polar space')
axpol.set_xlim([0, 2*np.pi])
axpol.set_xlabel('r')
axpol.set_ylabel('theta')
plt.show()
This produces:
(NOTE: Oops, the axis labels in the polar plots (left side) should be swapped in each of the images below)
Now, if we shift the theta array by pi:
theta = np.linspace(np.pi, 3*np.pi, 50)
and rerun the above, we see
Notice that the data plotted in the projected polar space successfully wraps the data at theta > 2*np.pi back to the beginning of the angular domain (since this is defined in the projections inverse transformation), such that it appears unchanged. In polar space, this does not happen.
Of course, this is expected; this axis has no associated transformation, and thus does know know how to wrap the data, or that it even should.
My question is, how can I enable this behavior, without having to shift the coordinates and data manually? That is, is there a way to have the axis on the left of the figure above inherit the polar transformation, but not the projection?
I would prefer to do this without defining my own transformation or projection objects. I thought there should be a way to inherit this small piece of the polar transformation, without doing the "full" transformation to Cartesian x,y.

