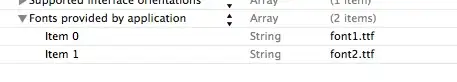
The easiest way to address this is probably to add style tags to your dashboard. You can put this anywhere. I usually put it right after the YAML or right after my first R chunk, where I just place my knitr options and libraries. This does not go inside an R chunk.
<style>
body {    /*push content away from far right and left edges*/
  margin-right: 2%;
  margin-left: 2%;
}
</style>
Update based on your updated question and comments
I don't have the content around your table, so I will give you a few options that work. For the most part, any one option won't be enough. You can mix and match the options that work best for you.
This is what I've got for the original table:
- Option 1: you can use CSS to push the table away from the edges (as in my original response
- Option 2: change the font sizes
- Option 3: constrain the size of the datatable htmlwidget
- Option 4: manually make the columns narrower
- Option 5: alter the filter labels (while keeping the same filters and data)
Aesthetically looks the best? It depends on what else is on the dashboard.
I think you will need the original CSS (option 1, in my original answer) regardless of what other options you choose to use.
Option 1 is above
Option 2
To change the font sizes, you have to modify the filter_checkbox and the datatable after they're made. Instead of presenting all of the programming code, I'm going to show you want to add or modify and how I broke down the objects.
Your original code for filter_checkbox remains the same. However, you'll assign it to an object, instead of including it in bscols.
Most of the code in your datatable will remain the same. there is an addition to the parameter options. I've included the original and change for that parameter.
# filter checkbox object
fc = filter_checkbox(...parameters unchanged...)
fc$attribs$style <- css(font.size = "90%") # <-change the font size

dt = datatable(
    ...
    ...
    options = list( # this will be modified
      autoWidth = TRUE,      # <- same
      scrollY = F,           # <- same
      initComplete = JS(          # <- I'M NEW! change size of all font
        "function(settings, json) {",
        "$(this.api().table().container()).css({'font-size': '90%'});",
        "}"),
      columnDefs = list(      # <- same
        list(className = 'dt-center', targets = c(2, 3, 4, 5))),
      ...
      ... # remainder of datatable and formatStyles() original code
 )

# now call them together
bscols(list(fc, dt))
The top version is with 90% font size, whereas the bottom is the original table.

Option 3
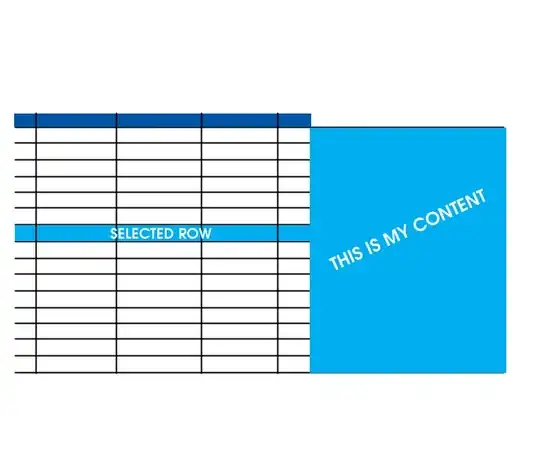
To constrain the size of the datatable widget, you'll need to create the object outside of bscols, like I did in option 2. If you were to name your widget dt as in my example, this is how you could constrain the widget size. This example sets the datatable to be 50% of the width and height viewer screen (or 1/4 of the webpage). Keep in mind that the filters are not part of the widget, so in all, the table is still more than 1/4th of the webpage. You will have to adjust the size for your purposes, of course. I recommend using a dynamic sizing mechanism like vw, em, rem, and the like.
dt$sizingPolicy$defaultWidth <- "50vw"
dt$sizingPolicy$defaultHeight <- "40vh"
The top image has options 1, 2, and 3; the bottom is the original table.

Option 4
To modify the width of the columns, you can add this modification to the parameter options in you call to datatable. This could be good, because most of the columns don't require as much width as the last column. However, if you change the font size or scale the table, it will change the font size dynamically, so this option may not be necessary.
Despite using em here, in the course of this going from R code to an html_document, it was changed to pixels. So this is not dynamically sized. (Not a great idea! Sigh!)
columnDefs = list(
        list(className = 'dt-center', targets = c(2, 3, 4, 5)),
        list(width = '5em', targets = c(1,2,3,4,5))), # <- I'm NEW!
Option 5
For this option, I took the programming behind crosstalk::filter_checkbox() and modified the code a bit. I changed the function to filter_checkbox2(). If you use it, you can render it both ways and just keep the one you like better.
This first bit of code is the three functions that work together to create a filter_checkbox object with my modifications so that you can have a label that isn't exactly the same as the levels.
It's important to note that the filters are alphabetized by datatable. It doesn't matter if they're factors, ordered, etc. If you use this new parameter groupLabels, they need to be in an order that aligns with the levels when they're alphabetized.
I put this code in an include=F chunk by itself:
# this is nearly identical to the original function
filter_checkbox2 = function (id, label, sharedData, group,
                             groupLabels = NULL, # they're optional
                            allLevels = FALSE, inline = FALSE, columns = 1) {
    options <- makeGroupOptions(sharedData, group,
                                groupLabels, allLevels) # added groupLabels
    labels <- options$items$label
    values <- options$items$value
    options$items <- NULL
    makeCheckbox <- if (inline)
        inlineCheckbox
    else blockCheckbox
    htmltools::browsable(attachDependencies(tags$div(id = id,
        class = "form-group crosstalk-input-checkboxgroup crosstalk-input",
        tags$label(class = "control-label", `for` = id, label),
        tags$div(class = "crosstalk-options-group",
                 crosstalk:::columnize(columns,
            mapply(labels, values, FUN = function(label, value) {
                makeCheckbox(id, value, label)
            }, SIMPLIFY = FALSE, USE.NAMES = FALSE))),
        tags$script(type = "application/json", `data-for` = id,
                    jsonlite::toJSON(options, dataframe = "columns",
                                     pretty = TRUE))),
        c(list(crosstalk:::jqueryLib()),crosstalk:::crosstalkLibs())))
    }

inlineCheckbox = function (id, value, label) { # unchanged
  tags$label(class = "checkbox-inline",
             tags$input(type = "checkbox",
                        name = id, value = value),
             tags$span(label))
  }

# added groupLabels (optional)
makeGroupOptions = function (sharedData, group, groupLabels = NULL, allLevels) {
    df <- sharedData$data(withSelection = FALSE, withFilter = FALSE,
        withKey = TRUE)
    if (inherits(group, "formula"))
        group <- lazyeval::f_eval(group, df)
    if (length(group) < 1) {
        stop("Can't form options with zero-length group vector")
    }
    lvls <- if (is.factor(group)) {
        if (allLevels) {levels(group) }
        else { levels(droplevels(group)) }
    }
    else { sort(unique(group)) }
    matches <- match(group, lvls)
    vals <- lapply(1:length(lvls), function(i) {
        df$key_[which(matches == i)]
    })
    lvls_str <- as.character(lvls)
    if(is.null(groupLabels)){groupLabels = lvls_str} # if none provided
    if(length(groupLabels) != length(lvls_str)){     # if the # labels != the # groups
      message("Warning: The number of group labels does not match the number of groups.\nGroups were used as labels.")
      groupLabels = lvls_str
    }
    options <- list(items = data.frame(value = lvls_str, label = groupLabels, # changed from lvls_str
        stringsAsFactors = FALSE), map = setNames(vals, lvls_str),
        group = sharedData$groupName())
    options
    }
When I used this new version of I changed label = "Level" to label = "Chronic Absenteeism Level". Then removed " Chronic Absenteeism" from the filter labels. The data and the datatable does not change, just the filter checkbox labels.
filter_checkbox2("abs_levels", "Chronic Absenteeism Level",
                      sd, ~ abs_levels, inline = TRUE,
                      groupLabels = unlist(unique(ican_tab$abs_levels)) %>%
                        str_replace(" Chronic Absenteeism", "") %>% sort())
The first image is your table with options 1, 2, 3, and 5 (not 4).
The top version in the next image has options 1, 2, 3, and 5 (not 4). The bottom is the original table. After that
If I've left anything unclear or if have any other questions, let me know.


