1

I am trying to plot multiple paths in a gganimate plot. I want the lines to fade out over the last N frames (e.g. N=5 in this example).

The data look like this:

set.seed(27)
df <- data.frame(Frame = rep(1:10, 3),
                 id = factor(rep(1:3, each = 10)),
                 x = runif(30),
                 y = runif(30))

head(df)

  Frame id          x          y
1     1  1 0.97175023 0.14257923
2     2  1 0.08375751 0.47864658
3     3  1 0.87386992 0.05182206
4     4  1 0.32923136 0.25514379
5     5  1 0.22227551 0.14262912
6     6  1 0.40164822 0.48288482

I tried to make the plot using shadow_mark, but this doesn't appear to have the lines fade out over time.

df %>%
  ggplot(aes(x = x, y = y, group = id, color = id)) +
  geom_path() +
  geom_point()+
  scale_color_manual(values=c("red","blue","green")) +
  transition_reveal(along = Frame) +
  shadow_mark(size = 0.75) +
  theme_void()

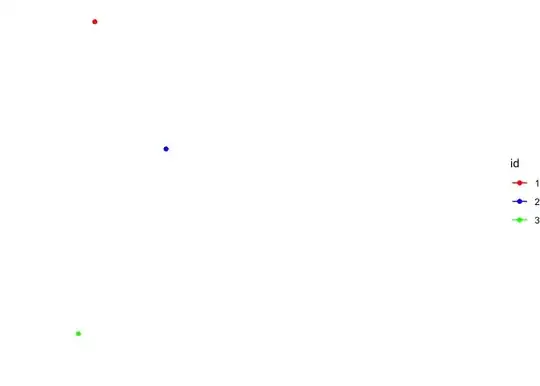
This just produces the below:

enter image description here

Is there a way to make these lines fade. Ideally, I'm just plotting a rolling path of N frames.

jalapic
  • 13,792
  • 8
  • 57
  • 87
  • Perhaps relevant? https://stackoverflow.com/questions/58271332/gganimate-plot-where-points-stay-and-line-fades/58347531#58347531 – Jon Spring Apr 25 '22 at 23:17
  • I tried adapting that code, but could not get it to cooperate with `transition_reveal()` – jalapic Apr 25 '22 at 23:37

1 Answers1

2

Is this something like what you're looking for? Adapted from the post mentioned in the comments. You don't need to use transition_reveal() if you use geom_segment().

library(gganimate)
library(dplyr)
library(tidyr)

set.seed(27)
n <- 10
df <- data.frame(Frame = rep(1:n, 3),
                 id = factor(rep(1:3, each = n)),
                 x = runif(3*n),
                 y = runif(3*n))

newdf <- df %>%
  uncount(n, .id = "newframe") %>%
  filter(Frame <= newframe) %>%
  arrange(newframe, Frame) %>%
  group_by(newframe, id) %>%
  mutate(x_lag = lag(x), 
         y_lag = lag(y),
         tail = last(Frame) - Frame,
         # Make the points solid for 1 frame then alpha 0
         point_alpha = if_else(tail == 0, 1, 0),
         # Make the lines fade out over 3 frames
         segment_alpha = pmax(0, (3-tail)/3)) %>%
  ungroup()

ggplot(newdf, 
       aes(x = y, y = x, xend = y_lag, yend = x_lag, group = Frame, color = id)) +
  geom_segment(aes(alpha = segment_alpha)) +
  geom_point(aes(alpha = point_alpha)) +
  scale_alpha(range = c(0,1)) +
  guides(alpha = F) +
  transition_manual(newframe) +
  theme_void() +
  scale_color_manual(values = c("red","blue","green")) 

lhs
  • 1,018
  • 2
  • 11