2

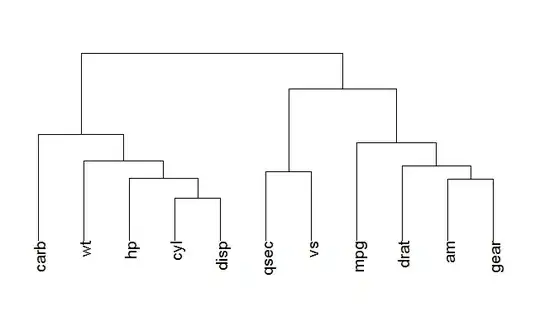
My question is related to Andrie's answer to my earlier question. My question is whether is this possible to display the variable labels and car label under the corresponding segments of the dendrogram?

library(ggplot2)
library(ggdendro)
data(mtcars)
x <- as.matrix(scale(mtcars))
dd.row <- as.dendrogram(hclust(dist(t(x))))
ddata_x <- dendro_data(dd.row)
p2 <- ggplot(segment(ddata_x)) +
geom_segment(aes(x=x0, y=y0, xend=x1, yend=y1))
print(p2)

enter image description here

MYaseen208
  • 22,666
  • 37
  • 165
  • 309
  • If you simplify your code to a **minimal** example I shall have a look. For example, if your question is how to add labels at the bottom to a dendrogram, then simplify the code to show a single dendrogram. – Andrie Aug 26 '11 at 09:14
  • @Andrie : I've updated the question with minimal code. Thanks – MYaseen208 Aug 27 '11 at 06:12

1 Answers1

6

Make sure you have version 0.0-7 of ggdendro and then use the convenience function ggdendrogram:

library(ggplot2)
library(ggdendro)
ggdendrogram(dd.row)

enter image description here

If you want full control over how the labels are displayed, you can extract and manipulate these from ddata_x using either:

ddata_x$labels
label(ddata_x)

To add to your plot:

p2 + geom_text(data=label(ddata_x), aes(label=text, x=x, y=0))

You can find more information in the vignette, vignette("ggdendro")

Andrie
  • 176,377
  • 47
  • 447
  • 496