I have the following pieces of code:
library("ggplot2")

x1 = as.numeric(x=QualidadeARO3$Ilhavo)
ggplot (QualidadeARO3, aes(x=x1, color="Ílhavo")) +
  geom_histogram(fill="black", position="dodge") +
  theme(legend.position="top") +
   xlab("microgramas por metro cúbico") +
   ylab("horas")
and
library("ggplot2")
x2 = as.numeric(x=QualidadeARO3$VNTelha_Maia)

ggplot(QualidadeARO3, aes(x=x2, color="VN Telha-Maia")) +
  geom_histogram(fill="blue", position="dodge")+
  theme(legend.position="top") +
  xlab("microgramas por metro cúbico") +
  ylab("horas")
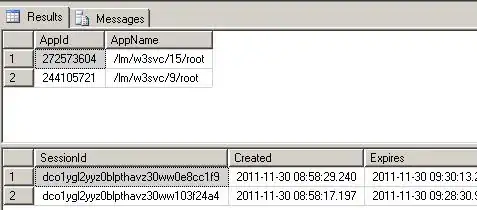
Where QualidadeARO3 is a data sheet imported from Excel that looks like this:
And both pieces of code output the following graphs, respectively:
However, I want to merge both graphs into a single mirrored histogram, with both color labels on top, how do I do this?


