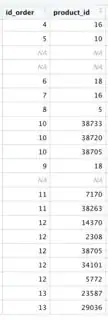
I'm preparing a master's degree project and stuck with basic data manipulation. I'm importing several data from the Prestashop database to R, one of those is a data frame with carts IDs and products included in it (see below).
What I want to do is to create a matrix that will reflect the same data but in the easiest way as a matrix, here's a draft of the most desirable look:
Any hints on how the code should look? Thank you in advance for any help!
EDIT:
Code sample (dataframe):
x <- data.frame (order_id  = c("12", "13","13","13","14","14","15","16"),
                   product_id = c("123","123","378","367","832","900",NA,"378"))
SOLUTION:
xtabs is good, but when it comes to NA values it skips the line in the results. There's an option to force addNA=TRUE, but it adds the NA 'column' and counts the NA as 1 (see below)
y <- xtabs(formula = ~., data = x)
Output - example 1 (addNA=FALSE):
        product_id
order_id 123 367 378 832 900
      12   1   0   0   0   0
      13   1   1   1   0   0
      14   0   0   0   1   1
      16   0   0   1   0   0
Output - example 2 (addNA=TRUE):
    product_id
order_id 123 367 378 832 900 <NA>
      12   1   0   0   0   0    0
      13   1   1   1   0   0    0
      14   0   0   0   1   1    0
      15   0   0   0   0   0    1
      16   0   0   1   0   0    0
The igraph approach seems to be more accurate.

